

How to Use KD Indicator? Strategies That Work
Have you ever heard of the KD indicator? If you're a trader, it's a term you should know.
KD stands for "Stochastic Oscillator," a technical analysis indicator that measures the momentum of an asset's price movement.
But what exactly does the KD indicator do, and how can it be used to make better trading decisions?
In this article, we'll dive into the basics of the KD indicator and explore its strategies. So if you're interested, keep reading to learn more!
What is the KD indicator?
The KD indicator, aka Stochastic Oscillator, is a technical analysis tool used to measure the momentum of an asset's price movement.
Despite its serious-sounding name, the KD indicator has a fun backstory. George Lane developed it in the late 1950s after observing that a chicken's behavior was similar to how the market moves.
Lane noticed that when a chicken flaps its wings rapidly, it tends to tire quickly and slow down.
Similarly, when the market moves too quickly in one direction, it tends to tire and may reverse. And so, the KD indicator was born!
KD belongs to a family of oscillators.
So, what does this mean?
It means it “oscillates” between certain ranges. KD fluctuates between 0 and 100, with readings above 80 indicating that the asset is overbought and below 20 illustrating that the asset is oversold.
By identifying overbought and oversold conditions, traders can use the KD indicator to anticipate potential price reversals. For example, if the KD indicator shows an overbought asset, it may be a good time to sell or take profits.
Don’t worry if overbought and oversold have got you confused. We’ll cover this in detail.
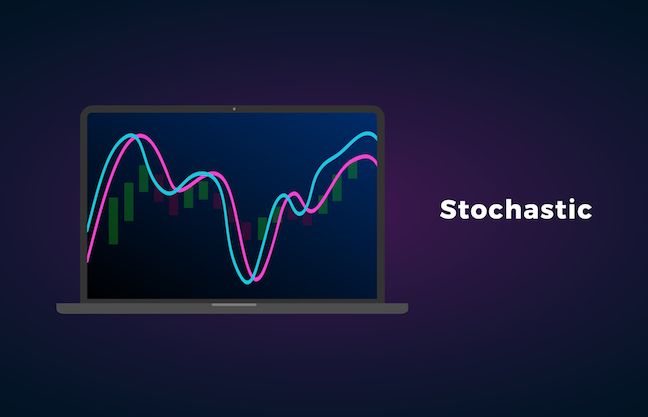
You may be thinking, why the name KD? It’s because Stochastics has two lines, %K and %D. The K is the length line, and the D is the smoothing line. You can see it on the chart below, where blue is the K line and orange is the D line.

Source:TradingView KD Indicator on the GBP/USD chart(D1)
How to calculate the KD indicator?
If you want to calculate KD, here is a formula for you. We know it’s boring and it reminds you of your Math teacher. But we have to do this, as the calculation can help you understand the basic principles of the KD indicator.
The basic principle of the KD indicator is to compare the closing price of an asset to its price range over a specific period, typically 14 days.
This calculation generates a percentage that indicates where the asset's closing price falls within its price range. The KD indicator is then plotted on a chart to identify potential trading signals.
Here's the formula:
%K = (Current Close - Lowest Low) / (Highest High - Lowest Low) * 100
Where;
The current Close is the closing price of the asset.
The lowest Low is the lowest price of an asset over the specified period.
The highest High is the highest price of an asset over the specified period.
Once the %K value is calculated, the KD indicator is plotted as a line on a chart. The line is then smoothed out using a moving average, typically with a period of 3 or 5 days, to create the %D line.
The formula of the %D line is %D = 3-day SMA of %K.
We know this is complex and boring, but you don't have to do calculations yourself. Most trading platforms like MT4 and MT5 have a built-in Stochastics oscillator, so you don't have to go through the hassle.
Also, you can check Mitrade’s App to learn more about the indicator.
How to use the KD indicator?
KD's utility lies in its ability to measure the momentum of an asset's price movement and identify overbought and oversold conditions. This makes it a valuable tool for short-term and long-term traders.
Also, you can use it for stocks, forex, and commodities and develop various strategies (more on the strategies part in a while).
Because it's a lagging indicator, it can be particularly useful in confirming trends and identifying potential reversals.
KD indicator settings
While the default settings for the KD indicator are usually sufficient for most traders, it's worth noting that the indicator can be customized to fit your trading style and preferences better.
Here are the default settings for the KD indicator on MT4:
%K Period: 5
Slowing: 3
%D Period: 3
K represents the period used to calculate the %K line while slowing and D are used to calculate the %D line.
If you want to experiment with different settings, you can adjust the values to fit your trading strategy better.
Be careful not to over-optimize the indicator, leading to false signals.

Source:MT4 KD indicator settings
KD indicator trading strategies
We know the KD indicator, its calculations, and its settings. Now we’ll talk about two of the most important trading strategies you can apply with the indicator.
1. KD indicator OB/OS
One of the most common ways to use the KD indicator is to identify overbought and oversold conditions in an asset's price.
As mentioned earlier, readings above 80 on the KD indicator indicate an asset is overbought, while readings below 20 indicate oversold.
Here's a simple strategy you can use:
Identify overbought/oversold conditions
Look for a KD reading above 80 to identify an overbought condition or below 20 to identify an oversold condition.
Wait for confirmation
Once you've identified an overbought or oversold condition, wait for confirmation before taking a trade. You can look for a bearish trend to confirm an overbought condition or a bullish trend to confirm an oversold condition.
Enter the trade
Once you've confirmed the overbought or oversold condition, enter a trade toward the expected reversal.
For example, you may want to enter a short trade if you've identified an overbought condition. Conversely, you can go long if you've identified an oversold condition.
Set stop-loss and take-profit levels
As with any trading strategy, it's important to set stop loss and take profit levels to manage risk and lock in profits.
You can place the stop-loss for a long entry below the low of your entry candle. For take profit, you can either hold until the indicator hits the overbought zone or choose the resistance level. You can put the stop-loss just above the swing high of your entry candle for short trades. Meanwhile, you can place take profit target at the next support level or hold a position until the indicator shows an oversold condition.
In the chart below, we identified an oversold level and exited the trade when the oscillator turned into the overbought level.

Source:TradingView KD Indicator strategy in GBP/USD Trading
2. KD indicator divergence
Divergence is another popular way to use the KD indicator in trading. Divergence occurs when the price of an asset is moving in the opposite direction of the KD indicator, indicating a potential trend reversal.
Here are a few advantages of using divergence with the KD indicator:
Divergence can provide an early warning sign that a trend reversal may occur.
By identifying the divergence between the price and the KD indicator, you can get a head start on potential trades and take advantage of price movements before they become too obvious.
Divergence can also be a confirmation tool for other technical analysis indicators.
Here’s how to trade with divergences using the KD indicator:
Identify divergence
Look for divergence between the price of an asset and the KD indicator. Before identifying a divergence, it's important to establish the direction of the trend.
Look for higher highs and higher lows in an uptrend and lower highs and lower lows in a downtrend.
Wait for confirmation
Once you've identified divergence, wait for confirmation before taking a trade. Look for a candlestick pattern or other technical analysis tool to confirm the potential reversal.
Enter a trade
Once you've confirmed the potential reversal, enter a trade toward the expected trend.
For example, you may want to enter a short trade if you've identified a bearish divergence. Conversely, you can enter a long trade if you've identified a bullish divergence.
Set SL and TP
You may want to set stop-loss levels just above or below the entry point. You can look at the previous high/low for take-profit levels.

Source:TradingView KD Indicator strategy in GBP/USD Trading
We had a bearish divergence in the chart above and entered a short trade.
Is the KD indicator enough?
For traders using the KD indicator, we recommend approaching it with caution. While the indicator can be a powerful tool for identifying potential trades, it's important to remember that no indicator is perfect, and false signals can occur.
So, use the KD indicator in conjunction with other technical analysis tools. Also, before making any trading decisions based on the indicator, take the time to do your due diligence and thoroughly analyze the market.
It's also essential to take the time to learn and understand the indicator thoroughly. As with any trading tool, the more you know about the KD indicator, the better equipped you'll be to use it effectively.
KD indicator pros and cons
Like other oscillators, KD comes with pros and cons. So, let’s see what those are:
Pros
The KD indicator is relatively simple to use and understand, making it accessible for traders of all levels.
It generates clear signals, making it easier to identify potential trades.
The indicator can help traders identify overbought and oversold conditions, which can be useful for finding potential trend reversals.
KD can be customized to fit specific trading styles and preferences.
Cons
The KD indicator is lagging and may not provide timely signals for quick market movements.
The indicator may not work well in ranging markets, as it's designed to identify trends and momentum.
Conclusion
The KD indicator can be useful for traders looking to identify trends, momentum, and overbought/oversold conditions in the market. While it's important to remember that no trading indicator is foolproof, the KD indicator can be valuable to your trading arsenal.
It's always best to practice proper risk management and do your due diligence.
Take the time to learn and understand the markets and indicator thoroughly on Mitrade’s App before using it in real-time trading.
What does Mitrade offer?
Direct market access | Deal on rising and falling markets | 24-hour trading | Limit and stop loss for every trade
* The content presented above, whether from a third party or not, is considered as general advice only. This article should not be construed as containing investment advice, investment recommendations, an offer of or solicitation for any transactions in financial instruments.

