

How To Use RSI Indicator? The A - Z Beginner’s Guide
The relative Strength Index (RSI) is one of the most used trading tools in the market. It falls in the same category as the stochastic oscillator and the MACD; momentum indicators. Perhaps, by the time you finish reading this article, you will find it helpful and incorporate it into your trading strategy. Here is the A to Z of the RSI indicator.
What Is RSI Indicator?
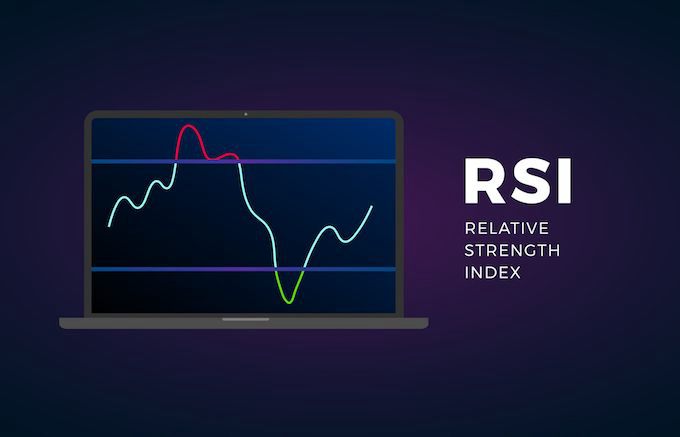
The RSI, called the Relative Strength Index, is a momentum oscillator that fluctuates between 0 and 100, and can provide insight into whether an asset is overbought (generally over 70) or oversold (generally under 30).
The RSI indicator appears below the instruments' price action in a separate window. Simply click on the indicator menu on the Mitrade trading platform to access the RSI indicator.
RSI indicator shares the same attributes as a stochastic oscillator. In fact, both indicators compare the closing price relative to the highs and the lows over a certain period. For this reason, many traders have a hard time differentiating the two indicators.

The indicator moves across the zones, giving trade entry signals and oversold and overbought market conditions. However, some traders go the extra mile and use the technical analysis tool to detect market divergence. Before we explore these strategies, let’s start from the basics.
Direct market access | Deal on rising and falling market | 24-hour trading | Limit and stop-loss for every trade
Structure of the Indicator and the Line Calculation
To understand how the RSI works, you need to understand the structure and how the current value of RSI is calculated. Now, you will need a relative strength (RS) to calculate the RSI. Remember, typically, the RSI uses a default setting of 14 periods. The relative strength is calculated as follows:
RS=14 EMA of the up bars/14 EMA of the down bars.
Now, with the RS value, calculating the RSI is pretty much straightforward.
RSI = (100 – (100 / (1 + RS)))
Essentially, the indicator is a leading indicator. It gives trading signals before the actual price movement on the price in the chart. RSI can be considered a leading indicator when it's used to identify the divergence between the RSI and the price of the asset, which can indicate a potential trend reversal. The signals give three trading signals, stipulated below.
Analysis: Spotting Overbought and Oversold Areas
Overbought Area
RSI is one of the most accurate indicators for identifying overbought areas. The indicator enters the area above the 70-score level. Ideally, the area shows the price is deep in the resistance zone, and supply pressure is neigh.
Once enough sellers enter the market, they push the prices down. As a result, the price plummets as the bears take control of the market. The whole idea is to wait for the indicator to enter the70 levels, start falling and break below the 70-score line.
When trading, you want to avoid going long on the overbought area. If anything, you should be waiting to short the currency pair. Of course, you might need a confirmation that tells you it's the right time to enter the market. For instance, the death cross comes in handy at this point.
Oversold Area
When the sellers push the price down, the price may hit a support level after the bearish run. The RSI indicator enters the area below the 30-line. At this point, sellers are leaving the market, and more buyers are joining. When the buyers regain market control, they push the price higher, resulting in a bullish rally.
The oversold area is a great place to buy at a discount before a swing trend that rallies to normal prices. Ideally, you want to wait for the indicator to dip into the range, start rising and break above the 30-line level. If you have long positions, you'll be smiling all the way to the bank. Of course, you might want to use additional tools for confirmation.
Using the Indicator to Identify Trending Market
You can use the indicator to identify the market trend. Ideally, the indicator will rise above 30 and move upwards, matching a rising price action trend. Similarly, a decline angle shows the market is plummeting and will likely sustain a bearish trend.
RSI Divergence for Trend Reversal
After a sustained trend, the market is bound to reverse. And the RSI is one of the best indicators to identify a price reversal. This is where divergence analysis comes in handy.
Divergence occurs when the price moves in the opposite direction from the price trend. For instance, if the RSI indicator is moving upwards and the price action is trending downwards, the divergence gives a bullish signal. The price will likely reverse and take an uptrend to match the direction of the RSI indicator.
Similarly, when RSI is moving downwards, and the price is trending up, that's another divergence. That's a bearish signal that the price will plummet and fall.
Things to Keep in Mind When Using RSI
When trading using the RSI, you want to ensure you are trading with the general trend. For instance, you should go long after the indicator breaks out of the oversold area. You see, the market moves up and down. However, the market eventually follows the general trend.
Put more precisely, you will find a small downtrend within the overall uptrend. Unless you want to benefit from small corrections, You should not trend against the trend ( countertrend).
You will likely encounter losses when you bet against the overall trend. Not because the indicator gives false signals, no. It gives the right trading signals which correspond to temporary price movement. For instance, during an overall downtrend, you might get small rallies corresponding to oversold signals. In this case, you might be tempted to open long positions. After going long, the market will likely resume the overall downtrend leading to losses.
Direct market access | Deal on rising and falling market | 24-hour trading | Limit and stop-loss for every trade
How To Use RSI Trading Strategies
You can use the RSI indicator to confirm trends and reversals, and place stop loss and take profit levels. How do you integrate the RSI into your trading strategy?
You can use the indicator by relying on overbought and oversold levels or divergence. When using the overbought and oversold, the whole idea is to buy and sell when the price action breaks outside the set thresholds (30 and 70 levels). When trading divergences, you want to enter the market when the price action closes three candles in the direction of the RSI.
Setting a Stop loss
The RSI is not foolproof. The indicator is susceptible to failure, although rare. For this reason, you'll want to use a stop loss. The ideal position to place the stop loss is below the recent swing low for long trades and the recent swing high for short positions.
Take Profits
There are numerous ways to use the indicator to set a take profit. For instance, you can take profit when the indicator posts opposite signals such as overbought, oversold, or divergence signals. However, you might also want to add other trading technical tools to take partial profits, such as trailing stops.
Trading Example

British Pound vs. Japanese Yen
The picture shows the price movement for the British pound versus the Japanese yen. The picture dips into the oversold area, a telltale sign that bear pressure might dwindle and give room to bullish pressure. The currency pair then resumes an uptrend. As mentioned, the indicator can show the price trend. During an uptrend, the indicator tends to take an upwards slant. Similarly, you should get ready to go short when the indicator enters the overbought area.
Advantages And Disadvantage of Using RSI
The indicator has numerous benefits as a research and evaluation tool. Some of the top advantages include the following.
Easy Analysis
The overbought and oversold regions are clearly marked. It's easy for rookie traders to use and still provides insightful and accurate analysis for seasoned traders.
Notifies of Trading Opportunities
Ideally, many traders use RSI to identify trading opportunities rather than using it alone to initiate a trade. The indicator notifies you when the indicator hits overbought and oversold areas. Therefore, you won't miss trading opportunities.
Simple to Use Formula
The indicator is formulated with a simple mathematical formula. The math behind the creation is simple. While you can easily follow the indicator performance, it helps to know how it's created
The indicator is endowed with numerous advantages but is not foolproof. You should know some disadvantages to work with the technical tool the best way. Improper use will only make matters worse.
Unpredictable Timeline for Price Reversal
Predicting price reversal can be challenging. While the indicator shows ideal price reversal prediction, it can stay in the overbought and oversold area for many days.
Using RSI to Confirm or Execute Trades Can Be an Uphill Task
To many traders, the RSI works as a cue to enter the market. Ideally, it shows when the asset enters an overbought and oversold zone. This prompts you to do more research and evaluation. However, it doesn’t provide a clear context to determine whether that's a good trading opportunity.
Less Accuracy in Strong Trend
During a strong trend, you'll want to use the indicator cautiously. It's not unlikely for the indicator to dip into an oversold area when the market is strongly trending upwards.
Mistakes to Avoid
Reading the indicator Incorrectly
The standard reading for overbought and oversold levels is 70 and 30. However, you might want to explore which value works best for various markets. The indicator has a degree of error. For instance, some markets work best at 90 levels. You can also enhance the reading by using a higher timeframe.
Failure to Use Stop Loss
As mentioned, the indicator isn't foolproof. It isn't 100 percent. The biggest mistake you can make is to fail to use a stop loss. Remember, every trading strategy involves entry, exit, and stop loss. It's impossible to predict future movement with absolute certainty. Stop loss shields your account should the market decide to behave erratically. Ideally, you should adjust your stop loss as the price action moves. In most cases, the indicator will give you great signals. The rule of thumb is: never trade without a stop loss.
Failure to Identify False Signals
How do you deal with potential false signals? You can easily deal with false signals by using other indicators, such as parabolic SAR. Is the overall trend rising or slanting? Ideal RSI signals should appear near dynamic resistance and support zones.
Don't Force signals. The market will always give you prime signals. Ensure the indicator gives you confidence and ideal signals I'm future.
Combining With Other Indicators
The RSI works well when you combine it with other indicators. For instance, you can pair the indicator with other tools, such as the average directional index, MACD, and moving averages. When two indicators align, that's a great way to identify trading opportunities. For instance, when the MACD line crosses below the zero line and RSI crosses below the overbought region, that's a perfect trading opportunity. You can also add Fibonacci.

The indicator shows a combination of RSI and MACD. The RSI has dipped into the oversold area. The idea is to wait for the indicator to leave the zone. The MACD should also cross from th negative to th positive side. Currently, it’s on the negative side. Both indicators give a signal of an impending rally.
Conclusion
The relative strength index is one of the best technical indicators. It is based on overbought and oversold areas. When the price hits the overbought area, it's an ideal area to go short as the price action leaves the zone and go long as the price moves from the oversold area. Ideally, the indicator signal should be in line with the overall trend. Open a Mitrade trading account, add RSI into your strategy, and your trading results will start smiling at you.
Start trading with Mitrade 0 commission, low spreads. Enjoy limit and stop loss for every trade!
Get Started
* The content presented above, whether from a third party or not, is considered as general advice only. This article should not be construed as containing investment advice, investment recommendations, an offer of or solicitation for any transactions in financial instruments.


