Amazon Q1 2025 Earnings Preview: Navigating Tariffs, E-commerce, and Cloud Growth

Source Tradingkey

TradingKey - Amazon is gearing up to unveil its Q1 2025 earnings, and investors are buzzing with anticipation. The market generally expects the company's revenue to be between $151 billion and $155.5 billion, a YoY increase of about 5% to 9%. Operating profit is expected to be between $14 billion and $18 billion, with an operating profit margin of approximately 9% to 11.5%. EPS is expected to be between $1.12 and $1.15, a slight increase from the same period last year. Despite tariff pressure and macroeconomic uncertainty, Amazon is still expected to maintain steady growth in revenue and profits with its scale advantages and technological innovation. This Q1 financial report is not only a reflection of performance, but also an important reference for observing how Amazon responds to challenges and plans for the future.
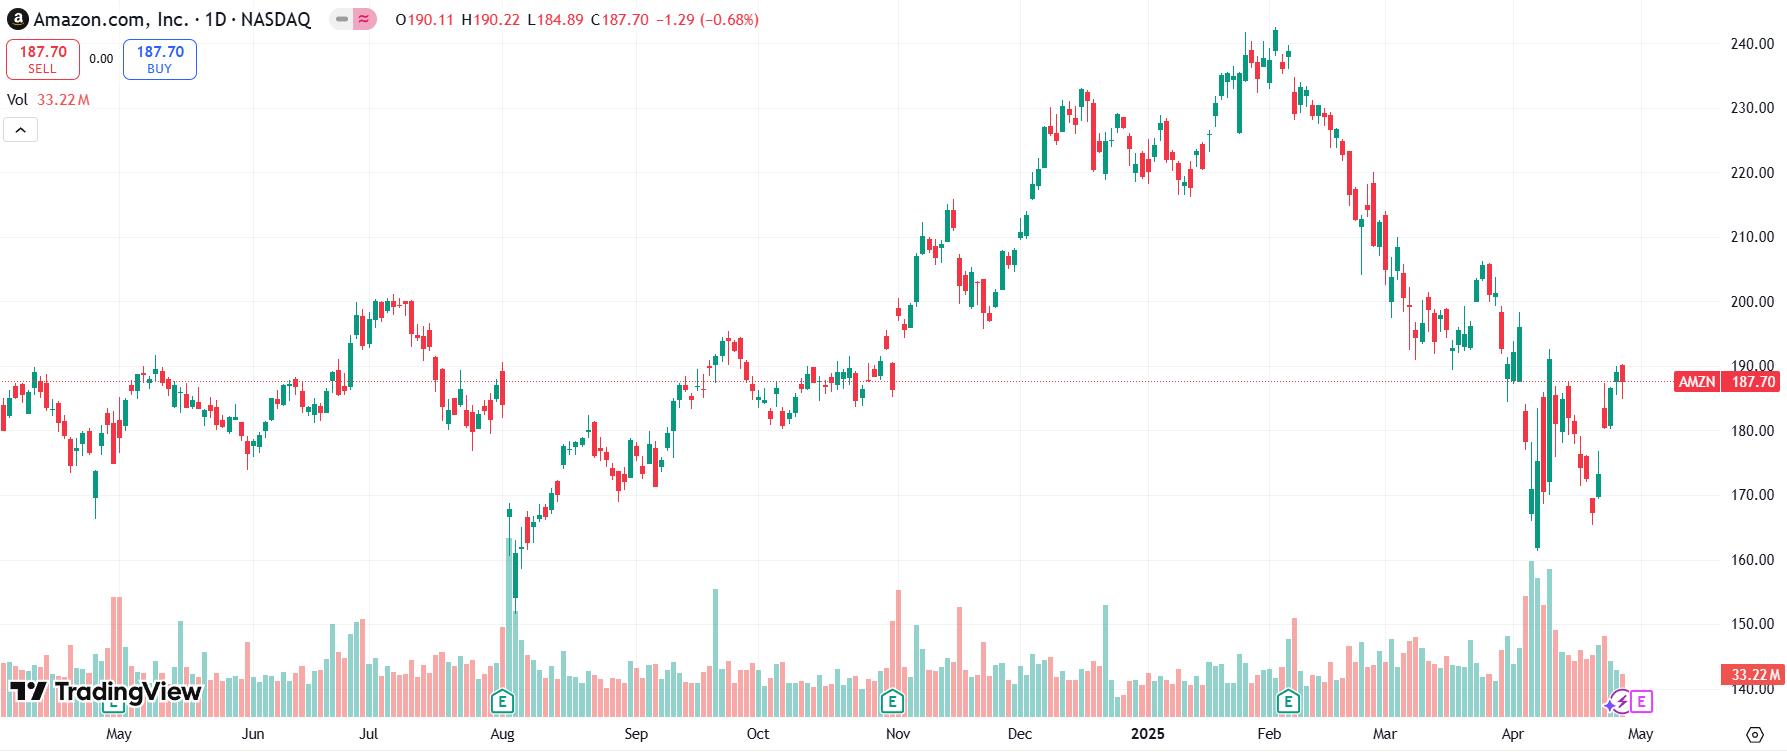
 Figure 1: Amazon

Source: Tradingview

Tariffs: A Bumpy Road, but Amazon’s Got Options

Tariffs are the elephant in the room. With U.S. tariffs on Chinese goods hitting as high as 145% and exemptions for low-value packages scrapped, competitors like Shein and Temu are feeling the heat. Some of their products have seen price hikes of over 300%, with Temu doubling prices to offset 130%-150% import fees. For Amazon, the impact is less severe but still worth watching. Unlike its Chinese rivals, Amazon’s massive scale and diverse supply chain give it a buffer. It can pass some of these costs to consumers and third-party sellers without taking a big hit to its bottom line, at least for now.

But here’s the catch: passing costs along isn’t a long-term fix. Shoppers are price-sensitive, especially if the economy slows down, and constant price increases could dampen demand. About 25% of Amazon’s self-run (1P) inventory comes from China, and this segment already runs on thin margins. Higher costs here could squeeze profits. Plus, Amazon’s dynamic pricing system keeps it tethered to competitors’ moves. If rivals like Shein or Temu absorb some tariff costs to stay competitive, Amazon might have to follow suit, which could pinch profits further.

Looking ahead, tariffs could push Amazon to rethink its supply chain. Shifting to new low-cost sourcing regions sounds great but comes with hefty costs and logistical headaches. For now, Amazon’s size and flexibility give it an edge over smaller players, but staying nimble will be key. Investors should watch how Amazon balances price competitiveness with profitability in this earnings report.

E-commerce: Steady Growth with a Side of Innovation

Amazon’s e-commerce engine keeps chugging along, even with tariff pressures. Third-party sellers, who drive about 60% of Amazon’s online sales, rely heavily on Chinese supply chains. With tariffs pushing up costs, many are raising prices or cutting back on ads, which could slow sales and platform activity in the short term. But Amazon isn’t sitting still. It’s leaning into AI-driven advertising to boost ad precision and customer conversions, turning this challenge into a potential profit driver. Smarter ads mean more bangs for sellers’ bucks, which could keep them spending even as costs rise.

Amazon’s also flexing its logistical muscle. By streamlining its supply chain and inventory management, it’s tackling bottlenecks and keeping costs in check. Compared to pure-play Chinese platforms, Amazon’s diverse product lineup and pricing power help it hold market share, especially as budget-conscious shoppers stick with trusted brands. Expect Amazon’s e-commerce revenue to grow around 8% year-over-year, hitting roughly $110 billion in Q1. That’s a solid showing, driven by Amazon’s ability to balance its own inventory with third-party seller flexibility.

The bigger picture? Amazon’s e-commerce business is about more than just sales. It’s about building a moat through better customer experiences, think faster shipping, exclusive perks like Prime, and personalized recommendations. Even though some sellers face tariff-related layoffs or price hikes, Amazon’s ecosystem looks resilient. Investors should keep an eye on how Amazon’s innovations, like AI-driven tools, strengthen its edge in a crowded market.

AWS: The Profit Powerhouse Faces New Challenges

AWS, Amazon’s cloud computing arm, is the real moneymaker, accounting for 17% of revenue but over 50% of operating profit with a juicy 37% margin. It’s the engine that keeps Amazon’s growth humming. Q1 AWS revenue is expected to continue to grow at double-digit rates, and profit margins remain high.

At the same time, Amazon is significantly increasing its capital investment in AWS, with capital expenditures expected to exceed $100 billion in 2025, focusing on global data center construction and custom chip research and development to consolidate its leading position in cloud computing and artificial intelligence. Although these investments will help improve AWS's competitiveness and market share in the long run, in the short term, the expansion rate has slowed down due to global supply chain bottlenecks, chip shortages, and power and motherboard supply restrictions. In fact, Amazon recently suspended leasing negotiations for some overseas data centers, indicating that the company has adopted a more cautious and flexible strategy in capital expenditure to cope with current external uncertainties.

AWS currently presents a state of high profit, high investment, and limited short-term expansion: profit contribution remains strong, but the capital-intensive growth model restricts the pace of expansion to a certain extent. In the future, as supply chain problems ease and AI applications continue to advance, AWS is expected to resume faster growth while maintaining a higher profit margin.

Outlook: Stock Poised to Break $200

With Amazon’s stock at approximately $187, the Q1 2025 earnings are expected to reflect robust performance. AWS will continue to be the core driving force for overall profitability. The e-commerce segment, despite tariff pressures, leverages scale and supply chain diversification to partially offset costs, while AI-driven advertising and logistics innovations drive operational efficiency and steady growth.

Amazon’s resilient business model and technological edge provide strong risk mitigation amid macroeconomic and trade uncertainties. Should the earnings meet or exceed expectations, the stock is well-positioned to break through $200 in the near term, potentially sparking a notable rally.

Disclaimer: For information purposes only. Past performance is not indicative of future results.
placeholder
Gold Price Forecast: XAU/USD drifts higher above $4,200 as Fed delivers expected cutGold price (XAU/USD) gains momentum to around $4,235 during the early Asian session on Thursday. The precious metal extends its upside after the US Federal Reserve (Fed) delivered an expected third consecutive interest rate cut and maintained its outlook for just one cut in 2026.
Author  FXStreet
Dec 11, Thu
Gold price (XAU/USD) gains momentum to around $4,235 during the early Asian session on Thursday. The precious metal extends its upside after the US Federal Reserve (Fed) delivered an expected third consecutive interest rate cut and maintained its outlook for just one cut in 2026.
placeholder
Gold remains bid as lack of Fed clarity and geopolitical frictions persistGold (XAU/USD) advances modestly on Friday as traders seem to book profits ahead of the weekend, yet clings to gains of over 0.51% after reaching a seven-week high of $4,353. At the time of writing, XAU/USD trades at $4,302 as traders digest comments from Federal Reserve (Fed) officials.
Author  FXStreet
Yesterday 01: 34
Gold (XAU/USD) advances modestly on Friday as traders seem to book profits ahead of the weekend, yet clings to gains of over 0.51% after reaching a seven-week high of $4,353. At the time of writing, XAU/USD trades at $4,302 as traders digest comments from Federal Reserve (Fed) officials.
placeholder
Ethereum Price Slips Lower — $3,000 Looms as the Key BattlegroundEthereum is attempting to recover from a $3,026 low but remains below $3,200 and the 100-hour SMA, with a bearish trend line near $3,175 capping rebounds as bulls need a clean break above $3,200 to target $3,250–$3,400, while a drop below $3,050 risks a retest of $3,000 and $2,940.
Author  Mitrade
Yesterday 03: 25
Ethereum is attempting to recover from a $3,026 low but remains below $3,200 and the 100-hour SMA, with a bearish trend line near $3,175 capping rebounds as bulls need a clean break above $3,200 to target $3,250–$3,400, while a drop below $3,050 risks a retest of $3,000 and $2,940.
placeholder
Macro Analysts: Hawkish Japan Could Push Bitcoin Below $70KAnalysts predict Bitcoin may face further declines towards the $70,000 mark if the Bank of Japan raises interest rates as expected.
Author  Mitrade
Yesterday 05: 48
Analysts predict Bitcoin may face further declines towards the $70,000 mark if the Bank of Japan raises interest rates as expected.
placeholder
Bitcoin Slides 5% as Sellers Lean In — Can BTC Reclaim $88,000?Bitcoin has dropped back below $88,000 after rolling over from $90,500, with price still trading under the 100-hour Simple Moving Average. The sell-off found a floor at $85,151, and BTC is now consolidating near that base, but rebounds are facing pressure from a bearish trend line around $89,000. Bulls need to retake $88,000–$89,000 to ease downside risk; failure to do so keeps $85,500–$85,000 and then $83,500 in play, with $80,000 as the deeper “line in the sand.” Bitcoin (BTC) is back in damage-control mode after a sharp pullback wiped out recent gains. The price failed to reclaim the $90,000–$90,500 band, rolled over, and slid through $88,500 before briefly dipping under $87,000. Buyers did show up around $85,000, but the rebound so far looks more like stabilization than a clear trend reversal. Bitcoin dips hard, finds a bid near $85,000(h3) BTC’s latest move lower began when it couldn’t build follow-through above $90,000 and $90,500. Once that upside stalled, sellers took control and pushed price down through $88,500. The slide accelerated enough to spike below $87,000, but the market didn’t free-fall. Bulls defended the $85,000 zone, printing a low at $85,151. Since then, Bitcoin has been consolidating below the 23.6% Fibonacci retracement of the drop from the $93,560 swing high to the $85,151 low — a clue that the bounce is still shallow and that sellers haven’t fully backed off yet. Structurally, BTC is still on the back foot: It’s trading below $88,000, and It remains below the 100-hour Simple Moving Average, keeping short-term trend pressure pointed downward. Resistance is layered, and $89,000 is the problem area(h3) If bulls try to turn this into a recovery, they’ll have to climb through multiple ceilings in quick succession. First, BTC faces resistance around $87,150, followed by a more meaningful barrier near $87,500. From there, the market’s attention snaps back to $88,000 — the level BTC just lost and now needs to reclaim. A close back above $88,000 would improve the tone, but it doesn’t solve the bigger issue: there’s a bearish trend line on the hourly BTC/USD chart (Kraken feed) with resistance near $89,000, which also lines up with the next technical hurdle. If BTC can push through $89,000 and hold, the rebound could extend toward $90,000, with follow-through targets at $91,000 and $91,500. But until price clears that $88,000–$89,000 zone, rallies are at risk of being sold rather than chased. If BTC fails to reclaim resistance, the downside path is clear(h3) The near-term bear case is simple: if Bitcoin can’t climb back above the $87,000 area and keep traction, sellers may attempt another leg lower. Support levels line up like this: Immediate support: $85,500 First major support: $85,000 Next support: $83,500 Then $82,500 in the near term Below that, the major “don’t break this” level is still $80,000. If BTC slips under $80,000, the risk of acceleration to the downside increases significantly — not because it’s magic, but because it’s the kind of psychological and structural level that tends to trigger forced de-risking. Indicators: momentum still leans bearish(h3) The intraday indicators aren’t offering much comfort yet: Hourly MACD is losing pace in the bearish zone. Hourly RSI remains below 50, suggesting sellers still have the upper hand on short timeframes. So while the $85,000 defense held for now, the market hasn’t flipped bullish — it’s just stopped bleeding.
Author  Mitrade
3 hours ago
Bitcoin has dropped back below $88,000 after rolling over from $90,500, with price still trading under the 100-hour Simple Moving Average. The sell-off found a floor at $85,151, and BTC is now consolidating near that base, but rebounds are facing pressure from a bearish trend line around $89,000. Bulls need to retake $88,000–$89,000 to ease downside risk; failure to do so keeps $85,500–$85,000 and then $83,500 in play, with $80,000 as the deeper “line in the sand.” Bitcoin (BTC) is back in damage-control mode after a sharp pullback wiped out recent gains. The price failed to reclaim the $90,000–$90,500 band, rolled over, and slid through $88,500 before briefly dipping under $87,000. Buyers did show up around $85,000, but the rebound so far looks more like stabilization than a clear trend reversal. Bitcoin dips hard, finds a bid near $85,000(h3) BTC’s latest move lower began when it couldn’t build follow-through above $90,000 and $90,500. Once that upside stalled, sellers took control and pushed price down through $88,500. The slide accelerated enough to spike below $87,000, but the market didn’t free-fall. Bulls defended the $85,000 zone, printing a low at $85,151. Since then, Bitcoin has been consolidating below the 23.6% Fibonacci retracement of the drop from the $93,560 swing high to the $85,151 low — a clue that the bounce is still shallow and that sellers haven’t fully backed off yet. Structurally, BTC is still on the back foot: It’s trading below $88,000, and It remains below the 100-hour Simple Moving Average, keeping short-term trend pressure pointed downward. Resistance is layered, and $89,000 is the problem area(h3) If bulls try to turn this into a recovery, they’ll have to climb through multiple ceilings in quick succession. First, BTC faces resistance around $87,150, followed by a more meaningful barrier near $87,500. From there, the market’s attention snaps back to $88,000 — the level BTC just lost and now needs to reclaim. A close back above $88,000 would improve the tone, but it doesn’t solve the bigger issue: there’s a bearish trend line on the hourly BTC/USD chart (Kraken feed) with resistance near $89,000, which also lines up with the next technical hurdle. If BTC can push through $89,000 and hold, the rebound could extend toward $90,000, with follow-through targets at $91,000 and $91,500. But until price clears that $88,000–$89,000 zone, rallies are at risk of being sold rather than chased. If BTC fails to reclaim resistance, the downside path is clear(h3) The near-term bear case is simple: if Bitcoin can’t climb back above the $87,000 area and keep traction, sellers may attempt another leg lower. Support levels line up like this: Immediate support: $85,500 First major support: $85,000 Next support: $83,500 Then $82,500 in the near term Below that, the major “don’t break this” level is still $80,000. If BTC slips under $80,000, the risk of acceleration to the downside increases significantly — not because it’s magic, but because it’s the kind of psychological and structural level that tends to trigger forced de-risking. Indicators: momentum still leans bearish(h3) The intraday indicators aren’t offering much comfort yet: Hourly MACD is losing pace in the bearish zone. Hourly RSI remains below 50, suggesting sellers still have the upper hand on short timeframes. So while the $85,000 defense held for now, the market hasn’t flipped bullish — it’s just stopped bleeding.
goTop
quote