

Before Retiring, Warren Buffett Left Investors With a $373 Billion Warning. Here's What History Says the Stock Market Will Do Next.
Key Points
Buffett was a net seller of stocks for 13 straight quarters at the end of his run as Berkshire's CEO.
There are two clear reasons for selling stocks, but only one reason he didn't buy more.
History suggests that the next decade could be hard for investors, but it could also present an opportunity.
- 10 stocks we like better than Berkshire Hathaway ›
Warren Buffett stepped down as CEO of Berkshire Hathaway (NYSE: BRKA) (NYSE: BRKB) at the start of the year, but his legacy will live on forever. In just over 60 years at the helm of the company, he turned a failing textile business into a massive conglomerate with a broad portfolio of wholly owned subsidiaries and an impressive marketable equity portfolio. In that time, Berkshire's value increased by a mind-boggling 6,099,294%, smashing the returns of the S&P 500, and creating many wealthy investors in the process.
While those studying and following Buffett throughout history know he's gone through many eras as an investor, the final era of his career stands out for what it suggests about his view of the current state of the stock market. In fact, he left Berkshire Hathaway issuing a massive warning to investors. It's clearly evident in the $373 billion sitting on Berkshire's balance sheet at the end of 2025.
Will AI create the world's first trillionaire? Our team just released a report on the one little-known company, called an "Indispensable Monopoly" providing the critical technology Nvidia and Intel both need. Continue »

Image source: The Motley Fool.
The $373 billion warning to investors
Buffett set a new record at Berkshire Hathaway when he closed the books on 2025. The company ended the year with $373 billion in cash and Treasuries on its balance sheet. That's up from $321 billion at the end of 2024 and $129 billion at the end of 2022.
That pile of cash didn't get there by accident. It resulted from massive stock sales led by Buffett and, more importantly, a dearth of purchases. In fact, Buffett sold more stock than he bought in each of the last 13 quarters of his tenure as CEO.
Some of his biggest sales included Apple and Bank of America. His decision to sell those holdings came after both companies produced phenomenal returns for Berkshire over the prior decade. New tax legislation lowered the corporate tax rate to just 21%, which Buffett viewed as an excellent opportunity to take gains on those stocks. The stock sales may have also helped Berkshire avoid the 15% alternative minimum tax in each of the last two years.
But if Buffett simply wanted to lock in a favorable tax rate, he could have bought back the stock he sold without incurring any penalties. Instead, he let cash pile up on Berkshire's balance sheet as he searched and waited for new investment opportunities. That suggests that he also felt Apple and Bank of America were overvalued when he sold them. Given that the stocks continue to trade near their recent highs, it's likely he still feels that way.
The big warning behind the $373 billion on Berkshire's balance sheet is that it suggests Buffett also thinks almost every other viable stock for Berkshire's portfolio is overvalued. If he felt there was good value out there, he'd have bought it. That includes Berkshire's own stock, which Buffett notably didn't repurchase in his final 19 months as CEO.
In his last letter to shareholders, Buffett noted that when it comes to investing in equities, "Often, nothing looks compelling." That seems to be the case for most of the last three years he spent running the company. He also notes that "very infrequently we find ourselves knee-deep in opportunities." Buffett appears to be preparing Berkshire's balance sheet for one of those periods, and history suggests it could be on the horizon.
What history says happens next
There are a handful of market valuation metrics suggesting that stocks, as a group, are very expensive right now. Buffett's preferred valuation metric, market-cap-to-GDP, otherwise known as the Buffett Indicator, sits near a record high at 217%. While there are a few reasons for the metric to move higher over the last 20 years, it still sits at an abnormally high level, indicating U.S. stocks are overvalued.
Perhaps one of the strongest predictors of long-term returns in history is the cyclically adjusted price-earnings (CAPE) ratio, developed by Robert Shiller. The CAPE ratio divides the current price by the average earnings of the previous 10 years, adjusted for inflation. Today, the S&P 500's CAPE ratio sits at 38.8. (It sat at 38.9 at the end of February.)
In every period since 1871, when the S&P 500's CAPE ratio exceeded 38.8, the S&P 500 produced negative returns over the next 10 years. Robert Shiller himself expects annualized returns of just 1.5% over the next decade based on the current CAPE ratio. When you factor in inflation, that falls into negative territory.
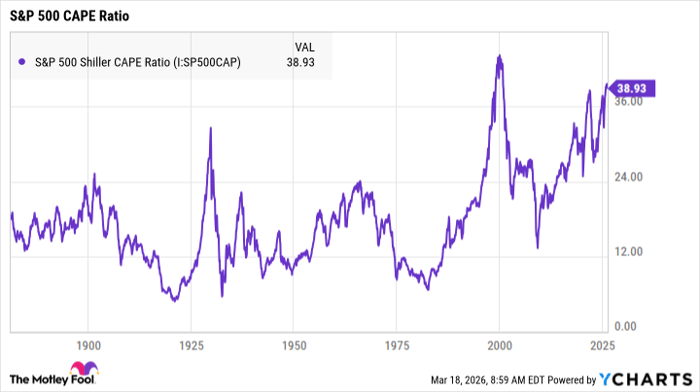
S&P 500 Shiller CAPE Ratio data by YCharts.
There's just one catch, however. There's only ever been one period where the S&P 500 CAPE ratio exceeded 38.8: The height of the dot-com bubble. Drawing conclusions from the 10-year period that followed, which included the bubble popping and the Great Financial Crisis, might not be prudent. The Great Financial Crisis was completely unrelated to the dot-com bubble popping.
Of course, Buffett, a student of history, markets, and psychology, knows that. Still, he found it tough to find good value in today's market. Investors who are willing to do their research can still find great values, though. You may be willing to look at companies Buffett ignored. Buffett famously avoided many tech stocks, and Berkshire's size limited its investment universe to the world's biggest companies.
While it may be wise to increase your cash allocation, you shouldn't sell everything and wait for a market downturn. Buffett notably still held a $300 billion equity portfolio for Berkshire when he retired.
Should you buy stock in Berkshire Hathaway right now?
Before you buy stock in Berkshire Hathaway, consider this:
The Motley Fool Stock Advisor analyst team just identified what they believe are the 10 best stocks for investors to buy now… and Berkshire Hathaway wasn’t one of them. The 10 stocks that made the cut could produce monster returns in the coming years.
Consider when Netflix made this list on December 17, 2004... if you invested $1,000 at the time of our recommendation, you’d have $495,179!* Or when Nvidia made this list on April 15, 2005... if you invested $1,000 at the time of our recommendation, you’d have $1,058,743!*
Now, it’s worth noting Stock Advisor’s total average return is 898% — a market-crushing outperformance compared to 183% for the S&P 500. Don't miss the latest top 10 list, available with Stock Advisor, and join an investing community built by individual investors for individual investors.
See the 10 stocks »
*Stock Advisor returns as of March 21, 2026.
Bank of America is an advertising partner of Motley Fool Money. Adam Levy has positions in Apple. The Motley Fool has positions in and recommends Apple and Berkshire Hathaway and is short shares of Apple. The Motley Fool has a disclosure policy.
Recommended Articles


