

Sumitomo Mitsui Financial Group Inc Stock (SMFG) Opened Down by 3.09% on Mar 12: Key Drivers Unveiled
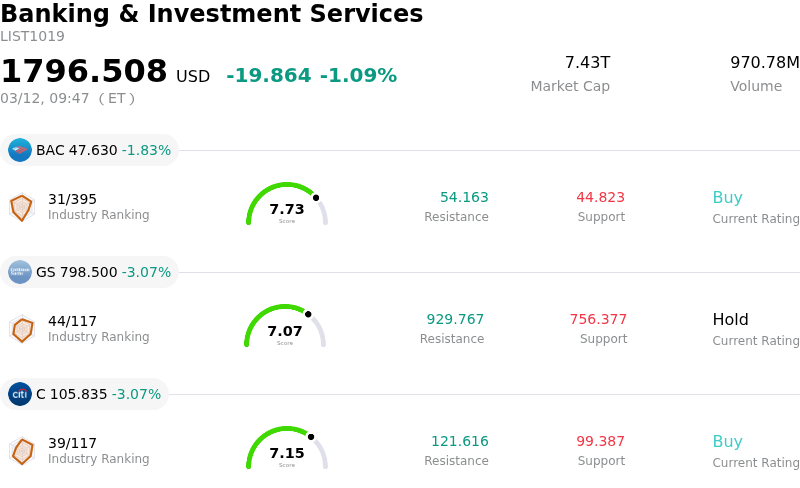
Sumitomo Mitsui Financial Group Inc (SMFG) opened down by 3.09%. The Banking & Investment Services sector is down by 1.09%. The company underperformed the industry. Top 3 stocks by turnover in the sector: Bank of America Corp (BAC) down 1.83%; Goldman Sachs Group Inc (GS) down 3.07%; Citigroup Inc (C) down 3.07%.
What is driving Sumitomo Mitsui Financial Group Inc (SMFG)’s stock price down today?
Sumitomo Mitsui Financial Group (SMFG) experienced downward price movement today, likely influenced by a confluence of factors affecting both its financial outlook and the broader Japanese banking sector. A primary contributor to investor concern stems from the company's recent third-quarter financial performance for the period ending December 31, 2025, where reported earnings per share fell below analyst expectations, despite revenue surpassing estimates. This earnings shortfall, initially reported in late January, continues to be a point of analysis for market participants and may be driving current re-evaluations of the stock.
Further adding to the cautious sentiment, the company's trailing twelve-month net profit margin showed a noticeable decline, shifting from nearly 29% to under 20%. This compression in margins, highlighted in late February, raises questions regarding the sustainability of future earnings and shareholder returns. Such a development can prompt investors to reassess the company's valuation in the short term.
Additionally, recent technical indicators suggest a weakening trend for SMFG shares. The stock moved below its 50-day moving average earlier in March, indicating a potential shift from an upward to a downward trajectory. Bearish signals were also observed in the Moving Average Convergence Divergence Histogram (MACD) in late February. These technical shifts can often reinforce negative investor sentiment and contribute to selling pressure.
Broader industry dynamics are also at play. The Japanese banking lobby announced plans today to establish risk management guidelines for leveraged loans, particularly those funding mergers and acquisitions. While these guidelines are not binding, they signal increased scrutiny within the sector, and concerns about potential regulatory impacts or stricter lending practices could create headwinds for major banks like SMFG. Moreover, discussions around the Bank of Japan's potential monetary tightening, including warnings about the negative impact of rapid interest rate hikes on the financial system, may contribute to overall market caution for financial institutions.
Technical Analysis of Sumitomo Mitsui Financial Group Inc (SMFG)
Technically, Sumitomo Mitsui Financial Group Inc (SMFG) shows a MACD (12,26,9) value of [-0.06], indicating a sell signal. The RSI at 34.99 suggests neutral condition and the Williams %R at -87.12 suggests oversold condition. Please monitor closely.
Fundamental Analysis of Sumitomo Mitsui Financial Group Inc (SMFG)
Sumitomo Mitsui Financial Group Inc (SMFG) is in the Banking & Investment Services industry. Its latest annual revenue is $33.23B, ranking 14 in the industry. The net profit is $7.73B, ranking 14 in the industry. Company Profile
Over the past month, multiple analysts have rated the company as , with an average price target of $23.47, a high of $23.47, and a low of $23.47.
More details about Sumitomo Mitsui Financial Group Inc (SMFG)
Company Specific Risks:
- Sumitomo Mitsui Financial Group (SMFG) faces financial exposure of at least 100 million pounds to Market Financial Solutions (MFS), a UK mortgage provider that collapsed in late February, contributing to a sharp decline in SMFG's shares.
- The company recently missed analysts' consensus earnings per share estimates significantly, reporting $0.16 versus an expected $0.40, raising concerns about future profitability.
- SMFG maintains an elevated debt-to-equity ratio of 1.63, which analysts highlight as a potential risk, particularly during economic downturns.
- Recent bearish technical signals, including a negative MACD Histogram and Momentum Indicator, along with analyst downgrades, suggest a potential for further stock decline and a lack of upward momentum.
Recommended Articles


