

Goldman Sachs Group Inc Stock (GS) Opened Down by 3.07% on Mar 12: Facts Behind the Movement
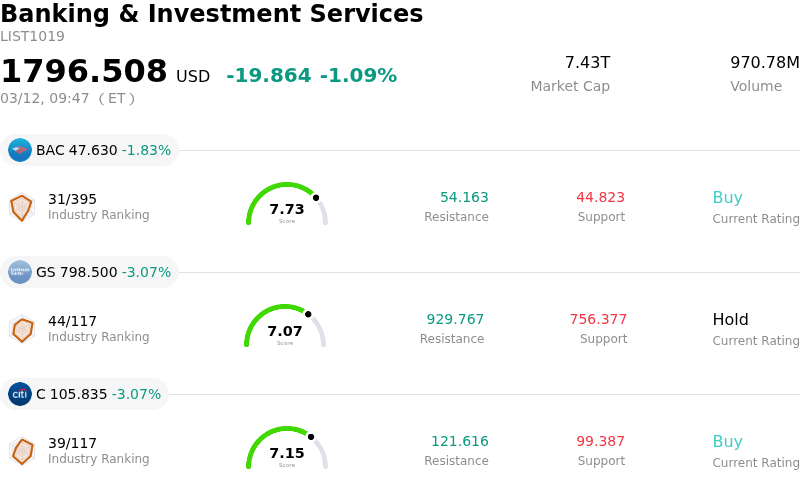
Goldman Sachs Group Inc (GS) opened down by 3.07%. The Banking & Investment Services sector is down by 1.09%. The company underperformed the industry. Top 3 stocks by turnover in the sector: Bank of America Corp (BAC) down 1.83%; Goldman Sachs Group Inc (GS) down 3.07%; Citigroup Inc (C) down 3.07%.
What is driving Goldman Sachs Group Inc (GS)’s stock price down today?
The share price for Goldman Sachs experienced a decline today, alongside notable intraday volatility. This downward movement appears to be primarily influenced by escalating geopolitical tensions and their reverberations across global financial markets.
Recent developments surrounding the conflict in the Middle East, particularly the disruption of shipping through the Strait of Hormuz, have led to a sharp increase in crude oil prices. This surge in energy costs is a significant concern for the near-term economic outlook, fostering market uncertainty and prompting a more bearish sentiment among investors. The ongoing US-Israeli war with Iran shows no signs of abating, further exacerbating these fears and threatening asset values within the financial sector.
These geopolitical factors are also contributing to renewed inflationary concerns. Goldman Sachs itself has reportedly delayed its outlook for a Bank of England rate cut, citing the inflationary impact of higher energy prices across Europe. This shift in monetary policy expectations, driven by external economic pressures, can negatively affect financial institutions by influencing interest rate environments and overall economic growth prospects.
Adding to the pressure, the company itself was recently downgraded to a "hold" rating by a major financial publication, partly due to technical chart patterns and broader macroeconomic and market concerns. This analytical adjustment, which highlighted potential impacts of equity market downturns on investment banks and noted the company's valuation appearing stretched, likely amplified negative investor sentiment. Furthermore, some institutional investors have shown signs of adjusting their positions in Goldman Sachs, with one firm reducing its stake in the recent past.
The combination of heightened geopolitical risks leading to inflationary pressures, a more cautious stance from central banks, and a backdrop of tempered analyst sentiment and institutional portfolio adjustments are contributing factors to the negative trading day experienced by Goldman Sachs.
Technical Analysis of Goldman Sachs Group Inc (GS)
Technically, Goldman Sachs Group Inc (GS) shows a MACD (12,26,9) value of [-17.56], indicating a sell signal. The RSI at 34.49 suggests neutral condition and the Williams %R at -79.94 suggests oversold condition. Please monitor closely.
Fundamental Analysis of Goldman Sachs Group Inc (GS)
Goldman Sachs Group Inc (GS) is in the Banking & Investment Services industry. Its latest annual revenue is $117.10B, ranking 2 in the industry. The net profit is $16.30B, ranking 1 in the industry. Company Profile
Over the past month, multiple analysts have rated the company as Hold, with an average price target of $962.28, a high of $1125.00, and a low of $614.29.
More details about Goldman Sachs Group Inc (GS)
Company Specific Risks:
- Goldman Sachs faces significant operational risk from an ongoing M&A drought and reduced capital markets activity, stemming from recent geopolitical tensions, which directly impacts core investment banking revenue streams.
- The firm is subject to a securities class action lawsuit filed on March 5, 2026, alleging omitted financial risks in offering documents for the Navan, Inc. IPO, for which Goldman Sachs acted as lead underwriter.
- Concerns exist regarding Goldman Sachs's massive $619 billion debt load, which increases leverage risk in an environment where interest rates are expected to remain "higher for longer," potentially impacting credit ratings and future interest expenses.
- Goldman Sachs Private Middle Market Credit II LLC's portfolio includes 15.7% of loans underwritten on annualized recurring revenue rather than EBITDA, and investments with payment-in-kind (PIK) terms, indicating exposure to higher-risk lending practices with potentially deferred cash interest payments.
Recommended Articles


