My Top 10 Stocks to Buy in 2025 Are Beating the Market by 8 Percentage Points. Should You Buy Them for 2026?

Source The Motley Fool

Key Points

  • The market is thriving on confidence in AI.

  • One year is a snapshot in time, and investors should focus on the long term.

  • Some excellent stocks have been negatively impacted by short-term headwinds.

  • 10 stocks we like better than Amazon ›

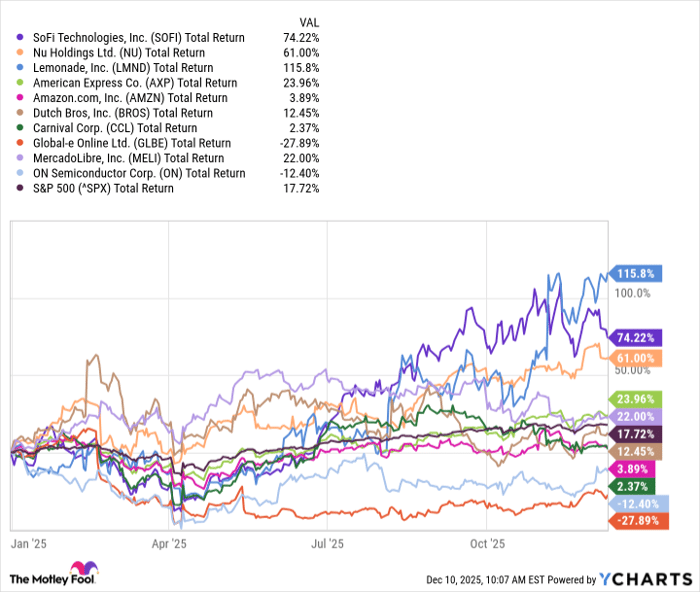
Every year, I choose 10 top stocks to buy, and I evaluate how they've done relative to the market at the end of the year. In the past, my list has done exceptionally well. As of Dec. 10, if you had invested $1,000 in each of these stocks at the beginning of the year, and $10,000 in the S&P 500, you'd have $12,754 with my list, versus $11,770 from an index fund. That's an 8-percentage-point beat with my list.

SOFI Total Return Level Chart

Where to invest $1,000 right now? Our analyst team just revealed what they believe are the 10 best stocks to buy right now, when you join Stock Advisor. See the stocks »

Data by YCharts.

Normally, I'd be pretty disappointed with these results; It's still market-beating performance, but not by much. However, it's a great opportunity to reflect on what it means to be a long-term investor. This year, some of these stocks have fallen short. But over the past three years, they have beaten the market by a staggering percentage.

SOFI Total Return Level Chart

Data by YCharts.

If you had invested $1,000 in each of these stocks three years ago and $10,000 in the S&P 500, you'd have $33,385, versus $16,990 for the S&P 500, or be up 235% vs. 69%. Those are fantastic results.

Even the greatest stocks of all time have off years or off times. Stock prices on a short-term basis could be affected by so many things, like market sentiment or a disappointing quarterly result. Rather than seeing them as destructive to the whole investing thesis, you can see them as a buying opportunity.

In fact, the two stocks that are actually losing value in 2025 are two of my highest-conviction holdings; their businesses are both performing fabulously this year, and I have confidence they'll bounce back and beat the market over the long term.

I would also point out that the S&P 500 has been buoyed by artificial intelligence (AI) enthusiasm this year, which has propped up its returns, whereas my list is low on AI. That negatively impacts my list right now relative to the index, but over many decades, AI trends will end up as a short-term tailwind relative to total market returns.

Two people looking at a phone and cheering.

Image source: Getty Images.

Let's take a quick look at each stock and what to think about it going into 2026:

1. Amazon

Amazon (NASDAQ: AMZN) is demonstrating strong growth in all of its businesses and has tremendous AI opportunities, but it's trailing the market this year. Investors seem to be concerned about competition and high AI spending. I wouldn't underestimate Amazon, and the sluggish price makes me even more confident about how much room it has to expand in 2026.

2. American Express

American Express (NYSE: AXP) is performing beautifully despite pressure on spending. It targets an affluent clientele that's less susceptible to inflationary issues, and it's well-positioned to manage through any rough times coming.

3. Carnival

Carnival (NYSE: CCL)(NYSE: CUK) performed phenomenally this year, but since some of its rebound is already priced into the stock, and investors are still worried about its debt, its stock was mediocre this year. It's still cheap, though, so if it makes strides in reducing the debt in 2026, the stock could outperform.

4. Dutch Bros

Dutch Bros (NYSE: BROS) had a fantastic 2025, but it's expensive, which might be why it's underperforming the market in 2025. That could lead to further low gains next year until the market is satisfied that not all of its growth is priced into the stock. Longer term, it looks like a no-brainer growth stock.

5. Lemonade

Lemonade (NYSE: LMND) has been the surprise winner for a few years. After the market seemed to have given up on it for a while, it's back in action. If it becomes profitable on the basis of adjusted earnings before interest, taxes, depreciation, and amortization (EBITDA) this year as expected, the stock could keep climbing.

6. Global-e Online

Global-e Online (NASDAQ: GLBE) has had a fabulous 2025, but its stock has been the biggest loser on this list. That's because it specializes in cross-border trade and is expected to be heavily impacted by global trade wars. However, it continues to report high growth, and it reached net profitability earlier than expected. It also quickly developed solutions for its clients to manage through a challenging tariff environment. That should get a bug thumbs-up from investors, and this looks like an opportunity to buy on the dip.

7. MercadoLibre

MercadoLibre (NASDAQ: MELI) has been a reliable market beater for some time. It continues to enjoy healthy opportunities throughout its large and growing e-commerce and fintech businesses, and I expect it to keep rewarding investors for years.

8. Nu Holdings

Nu Holdings (NYSE: NU) has had a fantastic year, and it could get even better in 2026. The Brazilian digital bank is capturing market share and expanding into new regions, and it recently applied for a U.S. bank charter, giving it multiple growth avenues.

9. On Holdings

On Holdings (NYSE: ONON) is the only other stock on this list that's down this year, and for similar reasons to Global-e: It's an international company that relies on China for production. However, the company continues to report high growth, and it has massive long-term opportunities. 2026 could be a much better year if the tariff issue settles down.

10. SoFi

SoFi Technologies (NASDAQ: SOFI) has impressed investors this year as growth accelerates and it launches new, innovative products. The digital bank is catching on with young customers who will growth with the company, and lower interest rates are helping it grow. Expect further growth in 2026 and beyond.

Should you buy stock in Amazon right now?

Before you buy stock in Amazon, consider this:

The Motley Fool Stock Advisor analyst team just identified what they believe are the 10 best stocks for investors to buy now… and Amazon wasn’t one of them. The 10 stocks that made the cut could produce monster returns in the coming years.

Consider when Netflix made this list on December 17, 2004... if you invested $1,000 at the time of our recommendation, you’d have $513,353!* Or when Nvidia made this list on April 15, 2005... if you invested $1,000 at the time of our recommendation, you’d have $1,072,908!*

Now, it’s worth noting Stock Advisor’s total average return is 965% — a market-crushing outperformance compared to 193% for the S&P 500. Don't miss the latest top 10 list, available with Stock Advisor, and join an investing community built by individual investors for individual investors.

See the 10 stocks »

*Stock Advisor returns as of December 16, 2025.

American Express is an advertising partner of Motley Fool Money. Jennifer Saibil has positions in American Express, Dutch Bros, Global-E Online, Lemonade, MercadoLibre, Nu Holdings, On Holding, and SoFi Technologies. The Motley Fool has positions in and recommends Amazon, Global-E Online, Lemonade, MercadoLibre, and On Holding. The Motley Fool recommends Carnival Corp., Dutch Bros, and Nu Holdings. The Motley Fool has a disclosure policy.

Disclaimer: For information purposes only. Past performance is not indicative of future results.
placeholder
Gold Price Forecast: XAU/USD drifts higher above $4,200 as Fed delivers expected cutGold price (XAU/USD) gains momentum to around $4,235 during the early Asian session on Thursday. The precious metal extends its upside after the US Federal Reserve (Fed) delivered an expected third consecutive interest rate cut and maintained its outlook for just one cut in 2026.
Author  FXStreet
Dec 11, Thu
Gold price (XAU/USD) gains momentum to around $4,235 during the early Asian session on Thursday. The precious metal extends its upside after the US Federal Reserve (Fed) delivered an expected third consecutive interest rate cut and maintained its outlook for just one cut in 2026.
placeholder
Gold remains bid as lack of Fed clarity and geopolitical frictions persistGold (XAU/USD) advances modestly on Friday as traders seem to book profits ahead of the weekend, yet clings to gains of over 0.51% after reaching a seven-week high of $4,353. At the time of writing, XAU/USD trades at $4,302 as traders digest comments from Federal Reserve (Fed) officials.
Author  FXStreet
Yesterday 01: 34
Gold (XAU/USD) advances modestly on Friday as traders seem to book profits ahead of the weekend, yet clings to gains of over 0.51% after reaching a seven-week high of $4,353. At the time of writing, XAU/USD trades at $4,302 as traders digest comments from Federal Reserve (Fed) officials.
placeholder
Ethereum Price Slips Lower — $3,000 Looms as the Key BattlegroundEthereum is attempting to recover from a $3,026 low but remains below $3,200 and the 100-hour SMA, with a bearish trend line near $3,175 capping rebounds as bulls need a clean break above $3,200 to target $3,250–$3,400, while a drop below $3,050 risks a retest of $3,000 and $2,940.
Author  Mitrade
Yesterday 03: 25
Ethereum is attempting to recover from a $3,026 low but remains below $3,200 and the 100-hour SMA, with a bearish trend line near $3,175 capping rebounds as bulls need a clean break above $3,200 to target $3,250–$3,400, while a drop below $3,050 risks a retest of $3,000 and $2,940.
placeholder
Macro Analysts: Hawkish Japan Could Push Bitcoin Below $70KAnalysts predict Bitcoin may face further declines towards the $70,000 mark if the Bank of Japan raises interest rates as expected.
Author  Mitrade
Yesterday 05: 48
Analysts predict Bitcoin may face further declines towards the $70,000 mark if the Bank of Japan raises interest rates as expected.
placeholder
Bitcoin Slides 5% as Sellers Lean In — Can BTC Reclaim $88,000?Bitcoin has dropped back below $88,000 after rolling over from $90,500, with price still trading under the 100-hour Simple Moving Average. The sell-off found a floor at $85,151, and BTC is now consolidating near that base, but rebounds are facing pressure from a bearish trend line around $89,000. Bulls need to retake $88,000–$89,000 to ease downside risk; failure to do so keeps $85,500–$85,000 and then $83,500 in play, with $80,000 as the deeper “line in the sand.” Bitcoin (BTC) is back in damage-control mode after a sharp pullback wiped out recent gains. The price failed to reclaim the $90,000–$90,500 band, rolled over, and slid through $88,500 before briefly dipping under $87,000. Buyers did show up around $85,000, but the rebound so far looks more like stabilization than a clear trend reversal. Bitcoin dips hard, finds a bid near $85,000(h3) BTC’s latest move lower began when it couldn’t build follow-through above $90,000 and $90,500. Once that upside stalled, sellers took control and pushed price down through $88,500. The slide accelerated enough to spike below $87,000, but the market didn’t free-fall. Bulls defended the $85,000 zone, printing a low at $85,151. Since then, Bitcoin has been consolidating below the 23.6% Fibonacci retracement of the drop from the $93,560 swing high to the $85,151 low — a clue that the bounce is still shallow and that sellers haven’t fully backed off yet. Structurally, BTC is still on the back foot: It’s trading below $88,000, and It remains below the 100-hour Simple Moving Average, keeping short-term trend pressure pointed downward. Resistance is layered, and $89,000 is the problem area(h3) If bulls try to turn this into a recovery, they’ll have to climb through multiple ceilings in quick succession. First, BTC faces resistance around $87,150, followed by a more meaningful barrier near $87,500. From there, the market’s attention snaps back to $88,000 — the level BTC just lost and now needs to reclaim. A close back above $88,000 would improve the tone, but it doesn’t solve the bigger issue: there’s a bearish trend line on the hourly BTC/USD chart (Kraken feed) with resistance near $89,000, which also lines up with the next technical hurdle. If BTC can push through $89,000 and hold, the rebound could extend toward $90,000, with follow-through targets at $91,000 and $91,500. But until price clears that $88,000–$89,000 zone, rallies are at risk of being sold rather than chased. If BTC fails to reclaim resistance, the downside path is clear(h3) The near-term bear case is simple: if Bitcoin can’t climb back above the $87,000 area and keep traction, sellers may attempt another leg lower. Support levels line up like this: Immediate support: $85,500 First major support: $85,000 Next support: $83,500 Then $82,500 in the near term Below that, the major “don’t break this” level is still $80,000. If BTC slips under $80,000, the risk of acceleration to the downside increases significantly — not because it’s magic, but because it’s the kind of psychological and structural level that tends to trigger forced de-risking. Indicators: momentum still leans bearish(h3) The intraday indicators aren’t offering much comfort yet: Hourly MACD is losing pace in the bearish zone. Hourly RSI remains below 50, suggesting sellers still have the upper hand on short timeframes. So while the $85,000 defense held for now, the market hasn’t flipped bullish — it’s just stopped bleeding.
Author  Mitrade
10 hours ago
Bitcoin has dropped back below $88,000 after rolling over from $90,500, with price still trading under the 100-hour Simple Moving Average. The sell-off found a floor at $85,151, and BTC is now consolidating near that base, but rebounds are facing pressure from a bearish trend line around $89,000. Bulls need to retake $88,000–$89,000 to ease downside risk; failure to do so keeps $85,500–$85,000 and then $83,500 in play, with $80,000 as the deeper “line in the sand.” Bitcoin (BTC) is back in damage-control mode after a sharp pullback wiped out recent gains. The price failed to reclaim the $90,000–$90,500 band, rolled over, and slid through $88,500 before briefly dipping under $87,000. Buyers did show up around $85,000, but the rebound so far looks more like stabilization than a clear trend reversal. Bitcoin dips hard, finds a bid near $85,000(h3) BTC’s latest move lower began when it couldn’t build follow-through above $90,000 and $90,500. Once that upside stalled, sellers took control and pushed price down through $88,500. The slide accelerated enough to spike below $87,000, but the market didn’t free-fall. Bulls defended the $85,000 zone, printing a low at $85,151. Since then, Bitcoin has been consolidating below the 23.6% Fibonacci retracement of the drop from the $93,560 swing high to the $85,151 low — a clue that the bounce is still shallow and that sellers haven’t fully backed off yet. Structurally, BTC is still on the back foot: It’s trading below $88,000, and It remains below the 100-hour Simple Moving Average, keeping short-term trend pressure pointed downward. Resistance is layered, and $89,000 is the problem area(h3) If bulls try to turn this into a recovery, they’ll have to climb through multiple ceilings in quick succession. First, BTC faces resistance around $87,150, followed by a more meaningful barrier near $87,500. From there, the market’s attention snaps back to $88,000 — the level BTC just lost and now needs to reclaim. A close back above $88,000 would improve the tone, but it doesn’t solve the bigger issue: there’s a bearish trend line on the hourly BTC/USD chart (Kraken feed) with resistance near $89,000, which also lines up with the next technical hurdle. If BTC can push through $89,000 and hold, the rebound could extend toward $90,000, with follow-through targets at $91,000 and $91,500. But until price clears that $88,000–$89,000 zone, rallies are at risk of being sold rather than chased. If BTC fails to reclaim resistance, the downside path is clear(h3) The near-term bear case is simple: if Bitcoin can’t climb back above the $87,000 area and keep traction, sellers may attempt another leg lower. Support levels line up like this: Immediate support: $85,500 First major support: $85,000 Next support: $83,500 Then $82,500 in the near term Below that, the major “don’t break this” level is still $80,000. If BTC slips under $80,000, the risk of acceleration to the downside increases significantly — not because it’s magic, but because it’s the kind of psychological and structural level that tends to trigger forced de-risking. Indicators: momentum still leans bearish(h3) The intraday indicators aren’t offering much comfort yet: Hourly MACD is losing pace in the bearish zone. Hourly RSI remains below 50, suggesting sellers still have the upper hand on short timeframes. So while the $85,000 defense held for now, the market hasn’t flipped bullish — it’s just stopped bleeding.
goTop
quote