$300 Billion Wiped Out: Why Broadcom’s "Flawless" Earnings Failed to Halt Wall Street’s Three-Day Slide

Source Tradingkey

TradingKey - Chip giant Broadcom is experiencing its most severe market sell-off since March 2020, with shares tumbling 18% in three days after its earnings report.

The post-earnings slide saw more than $300 billion in market capitalization evaporate, a sum roughly equivalent to the current market value of its chip competitor, AMD.

avgo-19c92e94a5504dc9a332515b760c9874

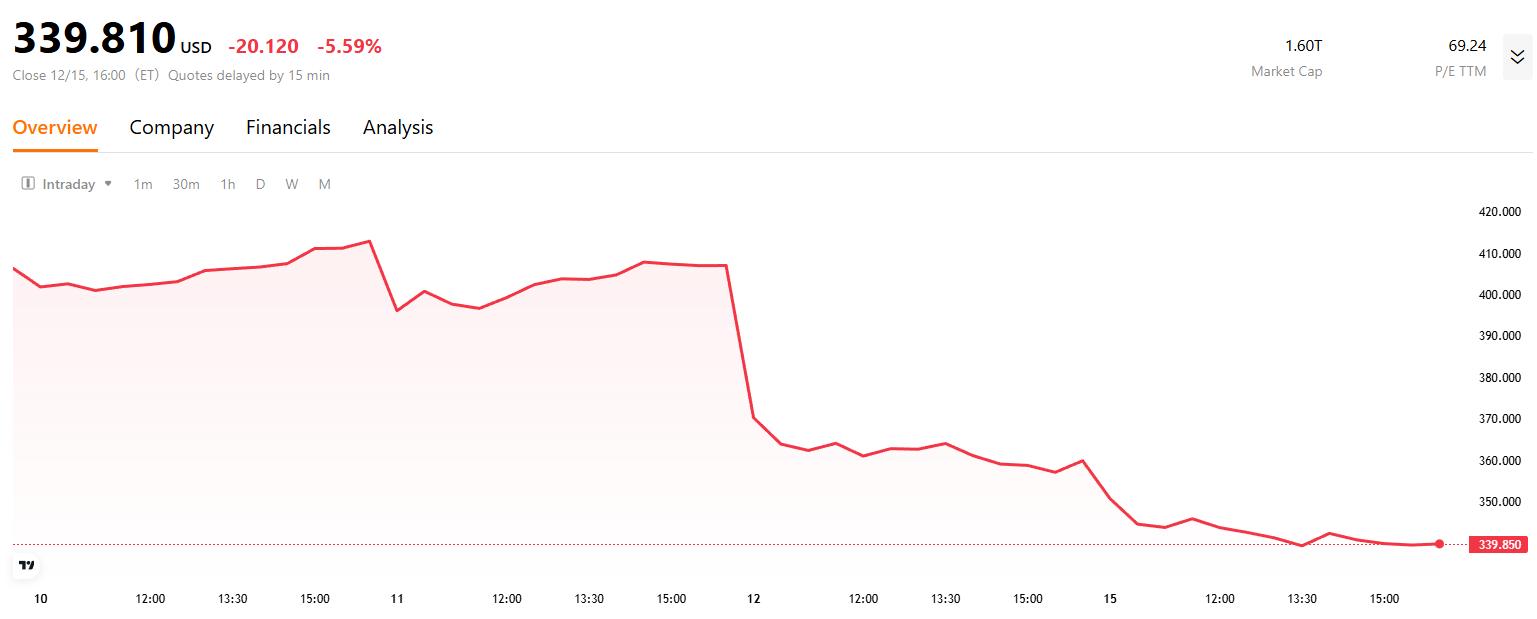
Dow Jones Market Data shows Broadcom's market capitalization, now $1.605 trillion, has been overtaken by Meta ($1.632 trillion), stripping it of its rank as the sixth-largest U.S. company.

Even with the recent decline, Broadcom's stock is still up more than 45% year-to-date. While the company's shares have experienced over 5% swings 25 times in the past year, this three-day consecutive plunge remains unusual.

This drastic volatility likely stems from investors re-evaluating the fundamental question of whether "high growth can justify high valuations" amidst escalating concerns about an AI bubble.

In calmer market periods, Broadcom's strong performance might have quelled doubts. However, as the AI investment frenzy intensifies, any hint of performance weakness risks being amplified by the market.

Why Did Strong Earnings Fail to Prevent the Sell-off?

Broadcom reported robust fourth-quarter revenue of $18.01 billion (+28% year-over-year) and a net profit of $9.71 billion (+39% year-over-year). Furthermore, its AI chip revenue surged by 74%, with an order backlog reaching $73 billion.

Yet, these impressive figures couldn't overshadow a core concern: management warned of a 100-basis-point sequential decline in gross margins, sparking market skepticism about the AI business's profitability.

Read more: "Broadcom's AI Revenue Soars 70% But Shares Fall on Margin Concerns and Client In-House Moves"

Broadcom CEO Hock Tan stated that artificial intelligence demand for 2026 is "difficult to predict," shattering prior optimistic market expectations for the stock.

Notably, Broadcom's capital expenditure over the past 12 months was only $623 million, significantly lower than the tens of billions invested by Nvidia and Oracle. The company also failed to disclose its AI infrastructure investment plans. Despite securing multi-billion dollar orders with Anthropic and OpenAI, the market remains skeptical about its ability to deliver on capacity.

TD Cowen analyst Joshua Buchalter pointed out that while investors harbored high expectations for Broadcom's deepening collaboration with OpenAI, the earnings report failed to clarify how this business would translate into revenue or specific timelines.

Adding to market disappointment, Broadcom announced a $1 billion custom chip delivery to an unnamed fifth client, expected by the end of next year. This figure fell significantly short of Wall Street's expectations for the scale of its OpenAI partnership.

Buchalter explained that such uncertainty unnerves investors; the market demands a clear roadmap, not vague promises.

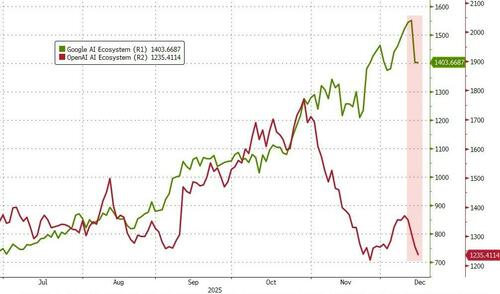
AI Supply Chain Takes a Hit

With Broadcom's stock plummeting over 17% in three days, two core pillars of the AI supply chain—the "Google ecosystem" and the "OpenAI ecosystem"—have simultaneously suffered significant blows.

ai-ecosystem

As a key player, Broadcom's earnings, while hitting a record high, saw AI business revenue forecasts fall short of Wall Street's exceptionally high expectations. Consequently, the market is beginning to question the return cycle on AI infrastructure investments.

Concurrently, core "OpenAI ecosystem" company Oracle faced revelations post-earnings that the completion date for its data center being built for ChatGPT owner OpenAI might be delayed from 2027 to 2028. This news has shaken market confidence in the pace of AI infrastructure development.

With both the "Google ecosystem" and "OpenAI ecosystem" facing a crisis of confidence, the entire AI supply chain's valuation logic is undergoing reassessment. Investors are now pondering: have we been overly optimistic in overestimating the speed and scale of AI adoption?

Why Is a 'Perfect 100' No Longer Enough? Wall Street Demands a '200'

Concurrently, a deeper question is permeating the market: why have Nvidia, Oracle, and CoreWeave, among other AI concept stocks, experienced sell-offs even after reporting strong earnings? Seemingly, even exceeding expectations in financial figures is no longer enough to satisfy Wall Street.

Perhaps the answer lies in the fact that Wall Street's expectations for AI concept stocks have escalated from a "perfect score of 100" to "a mandatory score of 200."When investors begin to question the sustainability of orders and the longevity of industry prosperity, even the strongest quarterly results struggle to calm market anxieties.

Broadcom's $300 billion market cap evaporation in three days underscores that even above-expectation performance fails to soothe investors' "fear of heights" regarding valuations.

"This isn't a repudiation of Broadcom, but rather a repricing of the entire AI investment thesis," confessed one hedge fund manager. "The market is shifting from 'believing everything' to 'needing evidence.' Investors are no longer content with concepts and expectations; they demand to see tangible profitability and a clear path to returns."

Disclaimer: For information purposes only. Past performance is not indicative of future results.
placeholder
Gold Price Forecast: XAU/USD drifts higher above $4,200 as Fed delivers expected cutGold price (XAU/USD) gains momentum to around $4,235 during the early Asian session on Thursday. The precious metal extends its upside after the US Federal Reserve (Fed) delivered an expected third consecutive interest rate cut and maintained its outlook for just one cut in 2026.
Author  FXStreet
Dec 11, Thu
Gold price (XAU/USD) gains momentum to around $4,235 during the early Asian session on Thursday. The precious metal extends its upside after the US Federal Reserve (Fed) delivered an expected third consecutive interest rate cut and maintained its outlook for just one cut in 2026.
placeholder
Gold remains bid as lack of Fed clarity and geopolitical frictions persistGold (XAU/USD) advances modestly on Friday as traders seem to book profits ahead of the weekend, yet clings to gains of over 0.51% after reaching a seven-week high of $4,353. At the time of writing, XAU/USD trades at $4,302 as traders digest comments from Federal Reserve (Fed) officials.
Author  FXStreet
Yesterday 01: 34
Gold (XAU/USD) advances modestly on Friday as traders seem to book profits ahead of the weekend, yet clings to gains of over 0.51% after reaching a seven-week high of $4,353. At the time of writing, XAU/USD trades at $4,302 as traders digest comments from Federal Reserve (Fed) officials.
placeholder
Ethereum Price Slips Lower — $3,000 Looms as the Key BattlegroundEthereum is attempting to recover from a $3,026 low but remains below $3,200 and the 100-hour SMA, with a bearish trend line near $3,175 capping rebounds as bulls need a clean break above $3,200 to target $3,250–$3,400, while a drop below $3,050 risks a retest of $3,000 and $2,940.
Author  Mitrade
Yesterday 03: 25
Ethereum is attempting to recover from a $3,026 low but remains below $3,200 and the 100-hour SMA, with a bearish trend line near $3,175 capping rebounds as bulls need a clean break above $3,200 to target $3,250–$3,400, while a drop below $3,050 risks a retest of $3,000 and $2,940.
placeholder
Macro Analysts: Hawkish Japan Could Push Bitcoin Below $70KAnalysts predict Bitcoin may face further declines towards the $70,000 mark if the Bank of Japan raises interest rates as expected.
Author  Mitrade
Yesterday 05: 48
Analysts predict Bitcoin may face further declines towards the $70,000 mark if the Bank of Japan raises interest rates as expected.
placeholder
Bitcoin Slides 5% as Sellers Lean In — Can BTC Reclaim $88,000?Bitcoin has dropped back below $88,000 after rolling over from $90,500, with price still trading under the 100-hour Simple Moving Average. The sell-off found a floor at $85,151, and BTC is now consolidating near that base, but rebounds are facing pressure from a bearish trend line around $89,000. Bulls need to retake $88,000–$89,000 to ease downside risk; failure to do so keeps $85,500–$85,000 and then $83,500 in play, with $80,000 as the deeper “line in the sand.” Bitcoin (BTC) is back in damage-control mode after a sharp pullback wiped out recent gains. The price failed to reclaim the $90,000–$90,500 band, rolled over, and slid through $88,500 before briefly dipping under $87,000. Buyers did show up around $85,000, but the rebound so far looks more like stabilization than a clear trend reversal. Bitcoin dips hard, finds a bid near $85,000(h3) BTC’s latest move lower began when it couldn’t build follow-through above $90,000 and $90,500. Once that upside stalled, sellers took control and pushed price down through $88,500. The slide accelerated enough to spike below $87,000, but the market didn’t free-fall. Bulls defended the $85,000 zone, printing a low at $85,151. Since then, Bitcoin has been consolidating below the 23.6% Fibonacci retracement of the drop from the $93,560 swing high to the $85,151 low — a clue that the bounce is still shallow and that sellers haven’t fully backed off yet. Structurally, BTC is still on the back foot: It’s trading below $88,000, and It remains below the 100-hour Simple Moving Average, keeping short-term trend pressure pointed downward. Resistance is layered, and $89,000 is the problem area(h3) If bulls try to turn this into a recovery, they’ll have to climb through multiple ceilings in quick succession. First, BTC faces resistance around $87,150, followed by a more meaningful barrier near $87,500. From there, the market’s attention snaps back to $88,000 — the level BTC just lost and now needs to reclaim. A close back above $88,000 would improve the tone, but it doesn’t solve the bigger issue: there’s a bearish trend line on the hourly BTC/USD chart (Kraken feed) with resistance near $89,000, which also lines up with the next technical hurdle. If BTC can push through $89,000 and hold, the rebound could extend toward $90,000, with follow-through targets at $91,000 and $91,500. But until price clears that $88,000–$89,000 zone, rallies are at risk of being sold rather than chased. If BTC fails to reclaim resistance, the downside path is clear(h3) The near-term bear case is simple: if Bitcoin can’t climb back above the $87,000 area and keep traction, sellers may attempt another leg lower. Support levels line up like this: Immediate support: $85,500 First major support: $85,000 Next support: $83,500 Then $82,500 in the near term Below that, the major “don’t break this” level is still $80,000. If BTC slips under $80,000, the risk of acceleration to the downside increases significantly — not because it’s magic, but because it’s the kind of psychological and structural level that tends to trigger forced de-risking. Indicators: momentum still leans bearish(h3) The intraday indicators aren’t offering much comfort yet: Hourly MACD is losing pace in the bearish zone. Hourly RSI remains below 50, suggesting sellers still have the upper hand on short timeframes. So while the $85,000 defense held for now, the market hasn’t flipped bullish — it’s just stopped bleeding.
Author  Mitrade
6 hours ago
Bitcoin has dropped back below $88,000 after rolling over from $90,500, with price still trading under the 100-hour Simple Moving Average. The sell-off found a floor at $85,151, and BTC is now consolidating near that base, but rebounds are facing pressure from a bearish trend line around $89,000. Bulls need to retake $88,000–$89,000 to ease downside risk; failure to do so keeps $85,500–$85,000 and then $83,500 in play, with $80,000 as the deeper “line in the sand.” Bitcoin (BTC) is back in damage-control mode after a sharp pullback wiped out recent gains. The price failed to reclaim the $90,000–$90,500 band, rolled over, and slid through $88,500 before briefly dipping under $87,000. Buyers did show up around $85,000, but the rebound so far looks more like stabilization than a clear trend reversal. Bitcoin dips hard, finds a bid near $85,000(h3) BTC’s latest move lower began when it couldn’t build follow-through above $90,000 and $90,500. Once that upside stalled, sellers took control and pushed price down through $88,500. The slide accelerated enough to spike below $87,000, but the market didn’t free-fall. Bulls defended the $85,000 zone, printing a low at $85,151. Since then, Bitcoin has been consolidating below the 23.6% Fibonacci retracement of the drop from the $93,560 swing high to the $85,151 low — a clue that the bounce is still shallow and that sellers haven’t fully backed off yet. Structurally, BTC is still on the back foot: It’s trading below $88,000, and It remains below the 100-hour Simple Moving Average, keeping short-term trend pressure pointed downward. Resistance is layered, and $89,000 is the problem area(h3) If bulls try to turn this into a recovery, they’ll have to climb through multiple ceilings in quick succession. First, BTC faces resistance around $87,150, followed by a more meaningful barrier near $87,500. From there, the market’s attention snaps back to $88,000 — the level BTC just lost and now needs to reclaim. A close back above $88,000 would improve the tone, but it doesn’t solve the bigger issue: there’s a bearish trend line on the hourly BTC/USD chart (Kraken feed) with resistance near $89,000, which also lines up with the next technical hurdle. If BTC can push through $89,000 and hold, the rebound could extend toward $90,000, with follow-through targets at $91,000 and $91,500. But until price clears that $88,000–$89,000 zone, rallies are at risk of being sold rather than chased. If BTC fails to reclaim resistance, the downside path is clear(h3) The near-term bear case is simple: if Bitcoin can’t climb back above the $87,000 area and keep traction, sellers may attempt another leg lower. Support levels line up like this: Immediate support: $85,500 First major support: $85,000 Next support: $83,500 Then $82,500 in the near term Below that, the major “don’t break this” level is still $80,000. If BTC slips under $80,000, the risk of acceleration to the downside increases significantly — not because it’s magic, but because it’s the kind of psychological and structural level that tends to trigger forced de-risking. Indicators: momentum still leans bearish(h3) The intraday indicators aren’t offering much comfort yet: Hourly MACD is losing pace in the bearish zone. Hourly RSI remains below 50, suggesting sellers still have the upper hand on short timeframes. So while the $85,000 defense held for now, the market hasn’t flipped bullish — it’s just stopped bleeding.
goTop
quote