"Magnificent Seven" Winners and Losers in 2025, and Which Are Well Positioned Heading Into 2026

Source The Motley Fool

Key Points

  • Some "Magnificent Seven" stocks are outperforming the broader market this year, while others have lagged behind.

  • President Donald Trump's tariffs have had a more significant impact on some of these stocks than on others.

  • Some of the seven remain overvalued, while others could still have upside, but 2026 results may depend heavily on investor sentiment for AI as a whole.

  • 10 stocks we like better than Apple ›

The "Magnificent Seven" stocks have dominated the market and the financial news cycle for several years. These large tech companies, which generate tremendous free cash flow and profits, are also viewed as the largest potential beneficiaries of artificial intelligence (AI), a new technology that some experts believe will revolutionize everything.

All of these stocks now have market caps exceeding $1 trillion and collectively account for over a third of the broader benchmark S&P 500 index. While there are many other impressive AI stocks, this group garners the majority of investor interest. Here are the Magnificent Seven winners and losers in 2025, and which are well positioned heading into next year.

Where to invest $1,000 right now? Our analyst team just revealed what they believe are the 10 best stocks to buy right now, when you join Stock Advisor. See the stocks »

Person looking at numerous charts on large monitor.

Image source: Getty Images.

Winners and losers of 2025

Regardless of their AI capabilities and capital expenditures (capex), all companies in the Magnificent Seven were taken aback when President Donald Trump announced strikingly high tariffs on most of the country's major trading partners. The market initially tanked but then quickly recovered after being able to digest some of the tariff news and because inflation hasn't surged as many had expected, at least not yet.

The market is poised to post another strong year of returns, but a closer look at the year-to-date performance of the Magnificent Seven below suggests that tariffs may still be weighing on some members of this group. Apple (NASDAQ: AAPL) and Amazon (NASDAQ: AMZN) have underperformed, and both are heavily impacted by tariffs.

Apple manufactures many of its popular consumer products, such as the iPhone, in China, although it has started to shift more of its production to India and Vietnam. Many of Amazon's products are sourced from abroad, and several of its third-party sellers are based there.

META Chart

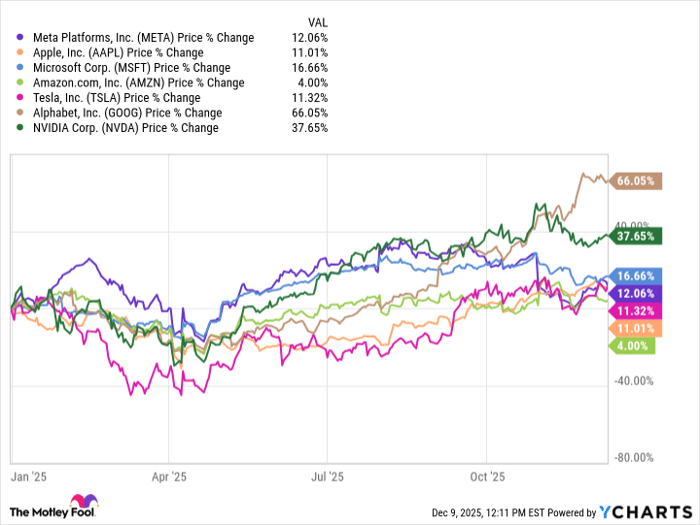
META data by YCharts.

Meanwhile, Alphabet (NASDAQ: GOOG)(NASDAQ: GOOGL) and Nvidia (NASDAQ: NVDA) have outperformed this year. Investors have broadly viewed Alphabet as the value play in the group. The company operates many strong business lines, but for several years has failed to unlock much of the value that shareholders and analysts believed possible.

Alphabet also faced pressure due to the U.S. Department of Justice's blockbuster lawsuit, which alleged that the company employed monopolistic practices in its core search and digital advertising business.

A federal judge sided with the Justice Department, but he failed to impose the harsh punishments that would have significantly harmed the company, such as requiring Alphabet to divest its Chrome business, which the Justice Department had requested.

Alphabet has also shaken off concerns about AI chatbots like OpenAI's ChatGPT, which many feared would take a significant share of the search market. While ChatGPT remains a threat, investors are more confident about Google's position following the release of several AI features.

Tariffs also challenged Nvidia, as did export restrictions imposed by the U.S. government, hurting the company's business in China. However, strong earnings and indications of AI demand, coupled with easing geopolitical tensions and the Trump administration's willingness to work with the company, have contributed to the stock's rebound.

Which are in a good position for 2026?

It's certainly possible that all stocks in the Magnificent Seven live and die in 2026 by how investor sentiment toward AI shapes up. Many of these names have seen their stocks surge due to the technology and have also planned to invest tens of billions, if not hundreds, into capex for AI infrastructure.

However, individually, I think Apple may be attractive for several reasons. Investors have criticized the company for not having a strong enough AI strategy, but in recent months, this has turned into an advantage of sorts, as investors have questioned all of the AI capex, which management hasn't been nearly as aggressive with.

Therefore, the stock can potentially perform well if AI sentiment sours, because it has less to lose. However, analysts expect Apple to potentially invest further into AI, so if this happens, the stock could also gain if investors see an improved strategic road map.

Others that are somewhat well positioned include Microsoft (NASDAQ: MSFT), Amazon, Alphabet, and Meta Platforms (NASDAQ: META). These are slightly safer AI stocks, since they operate many other successful businesses in addition to ones that are AI related. If there is a deep sell-off in AI, I still expect these companies to be able to navigate the difficult environment and maintain dominant positions in future decades.

I view Nvidia as a bit of a boom-or-bust proposition in 2026, depending on AI sentiment. If it is strong, the stock will likely outperform, but it could also have the most to lose if sentiment sours.

Lastly, I would avoid Tesla (NASDAQ: TSLA), which, in my view, trades at far too rich a valuation, because the risk-reward proposition is no longer favorable.

Should you buy stock in Apple right now?

Before you buy stock in Apple, consider this:

The Motley Fool Stock Advisor analyst team just identified what they believe are the 10 best stocks for investors to buy now… and Apple wasn’t one of them. The 10 stocks that made the cut could produce monster returns in the coming years.

Consider when Netflix made this list on December 17, 2004... if you invested $1,000 at the time of our recommendation, you’d have $513,353!* Or when Nvidia made this list on April 15, 2005... if you invested $1,000 at the time of our recommendation, you’d have $1,072,908!*

Now, it’s worth noting Stock Advisor’s total average return is 965% — a market-crushing outperformance compared to 193% for the S&P 500. Don't miss the latest top 10 list, available with Stock Advisor, and join an investing community built by individual investors for individual investors.

See the 10 stocks »

*Stock Advisor returns as of December 15, 2025.

Bram Berkowitz has no position in any of the stocks mentioned. The Motley Fool has positions in and recommends Alphabet, Amazon, Apple, Meta Platforms, Microsoft, Nvidia, and Tesla. The Motley Fool recommends the following options: long January 2026 $395 calls on Microsoft and short January 2026 $405 calls on Microsoft. The Motley Fool has a disclosure policy.

Disclaimer: For information purposes only. Past performance is not indicative of future results.
placeholder
Gold Price Forecast: XAU/USD drifts higher above $4,200 as Fed delivers expected cutGold price (XAU/USD) gains momentum to around $4,235 during the early Asian session on Thursday. The precious metal extends its upside after the US Federal Reserve (Fed) delivered an expected third consecutive interest rate cut and maintained its outlook for just one cut in 2026.
Author  FXStreet
Dec 11, Thu
Gold price (XAU/USD) gains momentum to around $4,235 during the early Asian session on Thursday. The precious metal extends its upside after the US Federal Reserve (Fed) delivered an expected third consecutive interest rate cut and maintained its outlook for just one cut in 2026.
placeholder
Gold remains bid as lack of Fed clarity and geopolitical frictions persistGold (XAU/USD) advances modestly on Friday as traders seem to book profits ahead of the weekend, yet clings to gains of over 0.51% after reaching a seven-week high of $4,353. At the time of writing, XAU/USD trades at $4,302 as traders digest comments from Federal Reserve (Fed) officials.
Author  FXStreet
Yesterday 01: 34
Gold (XAU/USD) advances modestly on Friday as traders seem to book profits ahead of the weekend, yet clings to gains of over 0.51% after reaching a seven-week high of $4,353. At the time of writing, XAU/USD trades at $4,302 as traders digest comments from Federal Reserve (Fed) officials.
placeholder
Ethereum Price Slips Lower — $3,000 Looms as the Key BattlegroundEthereum is attempting to recover from a $3,026 low but remains below $3,200 and the 100-hour SMA, with a bearish trend line near $3,175 capping rebounds as bulls need a clean break above $3,200 to target $3,250–$3,400, while a drop below $3,050 risks a retest of $3,000 and $2,940.
Author  Mitrade
Yesterday 03: 25
Ethereum is attempting to recover from a $3,026 low but remains below $3,200 and the 100-hour SMA, with a bearish trend line near $3,175 capping rebounds as bulls need a clean break above $3,200 to target $3,250–$3,400, while a drop below $3,050 risks a retest of $3,000 and $2,940.
placeholder
Macro Analysts: Hawkish Japan Could Push Bitcoin Below $70KAnalysts predict Bitcoin may face further declines towards the $70,000 mark if the Bank of Japan raises interest rates as expected.
Author  Mitrade
Yesterday 05: 48
Analysts predict Bitcoin may face further declines towards the $70,000 mark if the Bank of Japan raises interest rates as expected.
placeholder
Bitcoin Slides 5% as Sellers Lean In — Can BTC Reclaim $88,000?Bitcoin has dropped back below $88,000 after rolling over from $90,500, with price still trading under the 100-hour Simple Moving Average. The sell-off found a floor at $85,151, and BTC is now consolidating near that base, but rebounds are facing pressure from a bearish trend line around $89,000. Bulls need to retake $88,000–$89,000 to ease downside risk; failure to do so keeps $85,500–$85,000 and then $83,500 in play, with $80,000 as the deeper “line in the sand.” Bitcoin (BTC) is back in damage-control mode after a sharp pullback wiped out recent gains. The price failed to reclaim the $90,000–$90,500 band, rolled over, and slid through $88,500 before briefly dipping under $87,000. Buyers did show up around $85,000, but the rebound so far looks more like stabilization than a clear trend reversal. Bitcoin dips hard, finds a bid near $85,000(h3) BTC’s latest move lower began when it couldn’t build follow-through above $90,000 and $90,500. Once that upside stalled, sellers took control and pushed price down through $88,500. The slide accelerated enough to spike below $87,000, but the market didn’t free-fall. Bulls defended the $85,000 zone, printing a low at $85,151. Since then, Bitcoin has been consolidating below the 23.6% Fibonacci retracement of the drop from the $93,560 swing high to the $85,151 low — a clue that the bounce is still shallow and that sellers haven’t fully backed off yet. Structurally, BTC is still on the back foot: It’s trading below $88,000, and It remains below the 100-hour Simple Moving Average, keeping short-term trend pressure pointed downward. Resistance is layered, and $89,000 is the problem area(h3) If bulls try to turn this into a recovery, they’ll have to climb through multiple ceilings in quick succession. First, BTC faces resistance around $87,150, followed by a more meaningful barrier near $87,500. From there, the market’s attention snaps back to $88,000 — the level BTC just lost and now needs to reclaim. A close back above $88,000 would improve the tone, but it doesn’t solve the bigger issue: there’s a bearish trend line on the hourly BTC/USD chart (Kraken feed) with resistance near $89,000, which also lines up with the next technical hurdle. If BTC can push through $89,000 and hold, the rebound could extend toward $90,000, with follow-through targets at $91,000 and $91,500. But until price clears that $88,000–$89,000 zone, rallies are at risk of being sold rather than chased. If BTC fails to reclaim resistance, the downside path is clear(h3) The near-term bear case is simple: if Bitcoin can’t climb back above the $87,000 area and keep traction, sellers may attempt another leg lower. Support levels line up like this: Immediate support: $85,500 First major support: $85,000 Next support: $83,500 Then $82,500 in the near term Below that, the major “don’t break this” level is still $80,000. If BTC slips under $80,000, the risk of acceleration to the downside increases significantly — not because it’s magic, but because it’s the kind of psychological and structural level that tends to trigger forced de-risking. Indicators: momentum still leans bearish(h3) The intraday indicators aren’t offering much comfort yet: Hourly MACD is losing pace in the bearish zone. Hourly RSI remains below 50, suggesting sellers still have the upper hand on short timeframes. So while the $85,000 defense held for now, the market hasn’t flipped bullish — it’s just stopped bleeding.
Author  Mitrade
3 hours ago
Bitcoin has dropped back below $88,000 after rolling over from $90,500, with price still trading under the 100-hour Simple Moving Average. The sell-off found a floor at $85,151, and BTC is now consolidating near that base, but rebounds are facing pressure from a bearish trend line around $89,000. Bulls need to retake $88,000–$89,000 to ease downside risk; failure to do so keeps $85,500–$85,000 and then $83,500 in play, with $80,000 as the deeper “line in the sand.” Bitcoin (BTC) is back in damage-control mode after a sharp pullback wiped out recent gains. The price failed to reclaim the $90,000–$90,500 band, rolled over, and slid through $88,500 before briefly dipping under $87,000. Buyers did show up around $85,000, but the rebound so far looks more like stabilization than a clear trend reversal. Bitcoin dips hard, finds a bid near $85,000(h3) BTC’s latest move lower began when it couldn’t build follow-through above $90,000 and $90,500. Once that upside stalled, sellers took control and pushed price down through $88,500. The slide accelerated enough to spike below $87,000, but the market didn’t free-fall. Bulls defended the $85,000 zone, printing a low at $85,151. Since then, Bitcoin has been consolidating below the 23.6% Fibonacci retracement of the drop from the $93,560 swing high to the $85,151 low — a clue that the bounce is still shallow and that sellers haven’t fully backed off yet. Structurally, BTC is still on the back foot: It’s trading below $88,000, and It remains below the 100-hour Simple Moving Average, keeping short-term trend pressure pointed downward. Resistance is layered, and $89,000 is the problem area(h3) If bulls try to turn this into a recovery, they’ll have to climb through multiple ceilings in quick succession. First, BTC faces resistance around $87,150, followed by a more meaningful barrier near $87,500. From there, the market’s attention snaps back to $88,000 — the level BTC just lost and now needs to reclaim. A close back above $88,000 would improve the tone, but it doesn’t solve the bigger issue: there’s a bearish trend line on the hourly BTC/USD chart (Kraken feed) with resistance near $89,000, which also lines up with the next technical hurdle. If BTC can push through $89,000 and hold, the rebound could extend toward $90,000, with follow-through targets at $91,000 and $91,500. But until price clears that $88,000–$89,000 zone, rallies are at risk of being sold rather than chased. If BTC fails to reclaim resistance, the downside path is clear(h3) The near-term bear case is simple: if Bitcoin can’t climb back above the $87,000 area and keep traction, sellers may attempt another leg lower. Support levels line up like this: Immediate support: $85,500 First major support: $85,000 Next support: $83,500 Then $82,500 in the near term Below that, the major “don’t break this” level is still $80,000. If BTC slips under $80,000, the risk of acceleration to the downside increases significantly — not because it’s magic, but because it’s the kind of psychological and structural level that tends to trigger forced de-risking. Indicators: momentum still leans bearish(h3) The intraday indicators aren’t offering much comfort yet: Hourly MACD is losing pace in the bearish zone. Hourly RSI remains below 50, suggesting sellers still have the upper hand on short timeframes. So while the $85,000 defense held for now, the market hasn’t flipped bullish — it’s just stopped bleeding.
goTop
quote