
Fed Rate Cuts: Will the Russell 2000 Outperform the S&P 500?
Executive Summary
TradingKey - On 17 September, the Federal Reserve cut interest rates by 25 basis points, marking the official restart of the rate-cutting cycle. In theory, small-cap stocks, compared to large-cap stocks, benefit more from Fed rate cuts. This is because they are more reliant on external financing, more sensitive to U.S. domestic economic cycles, and considered higher-risk assets.
However, real-world economics is far more complex than theoretical models. Historically, rate-cutting cycles are rarely linear; they often proceed in a start-pause-restart pattern, with a clear pause period in rate reductions. For analytical purposes, we define the period before a pause as the "early phase" and the period after as the "later phase". During a rate-cutting cycle, two opposing forces interact in the U.S. stock market: the downward pressure from economic slowdowns and the upward support from the liquidity unleashed by rate cuts.
In the early phase of rate cuts, improved U.S. economic expectations reduced downward pressure on the stock market. As the later phase of the rate-cutting cycle begins and low interest rates are sustained, the supportive force from liquidity typically dominates. Historical data aligns with economic theory, showing that small-cap stocks particularly outperform in the later phase of rate-cutting cycles. Specifically, in the 12 months following the start of the later phase in 2001, 2003, 2008, and 2020, the Russell 2000 Index consistently outperformed the S&P 500 Index.
From September to December 2024, the Federal Reserve navigated the early phase of its rate-cutting cycle. Now, the central bank has entered the later phase of this cycle. If economic theory holds, history is likely to repeat itself. Consequently, looking ahead, the Russell 2000 Index is expected to outperform the S&P 500 Index in terms of returns.
Beyond Federal Reserve policy, investor concerns about the massive AI investments by tech giants failing to yield quick returns could prompt portfolio rebalancing, partly driving capital into small-cap stocks. On valuation grounds, while the Russell 2000's P/E ratio remains well below that of the S&P 500, it exceeds its five-year historical average and is nearing two standard deviations above it. Thus, valuations are unlikely to serve as the primary catalyst for Russell 2000 gains.
In summary, over the next 12 months, we anticipate U.S. stock prices will rise, with the Russell 2000 Index likely to outperform the S&P 500 Index. Ranking the driving forces by impact: Federal Reserve rate cuts are the primary catalyst, followed by portfolio rebalancing, with valuations having the least influence.
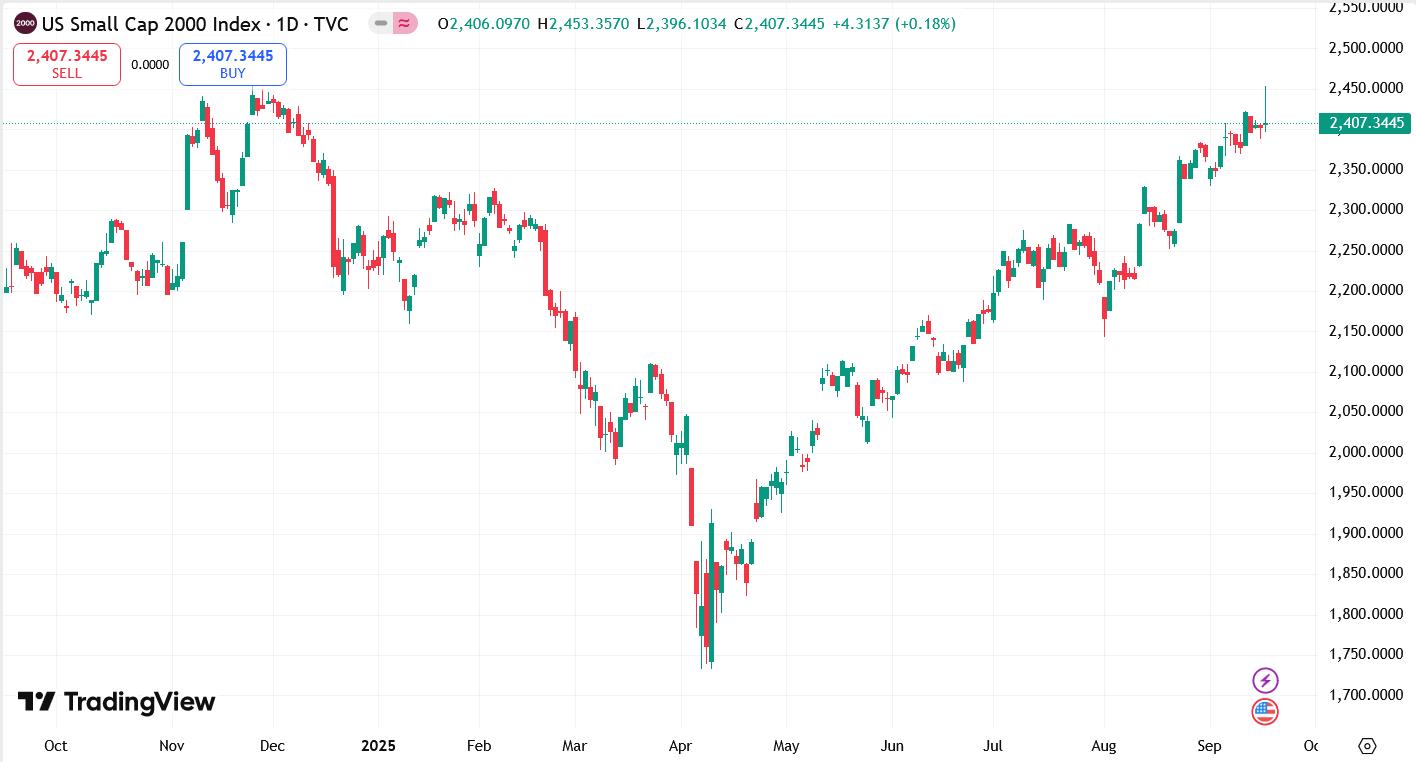
Source: TradingView
1. Introduction
In line with market consensus expectations, the Federal Reserve cut interest rates by 25 basis points on 17 September, marking the official restart of the rate-cutting cycle. Over the past 1-2 months, U.S. small-cap stocks have significantly outperformed large-cap stocks. From 1 August to 17 September, the Russell 2000 Index rose by 11.1%, far surpassing the S&P 500 Index’s 5.8% gain (Figure 1). This performance signals a clear rotation in the U.S. stock market, with capital flowing from large-cap to small-cap stocks. Looking ahead, what will the market’s trajectory be? Over the next 12 months, can the Russell 2000 continue to outperform the S&P 500?
This article analyses the future trajectory of the U.S. stock market from three perspectives: Federal Reserve rate cuts, portfolio rebalancing, and valuations. This framework aims to help investors capitalise on higher returns amid the rotation between large-cap and small-cap sectors. Notably, as we consider Federal Reserve rate cuts the most critical factor influencing the market’s outlook, this article will primarily focus on its monetary policy.
Figure 1: Russell 2000 vs. S&P 500
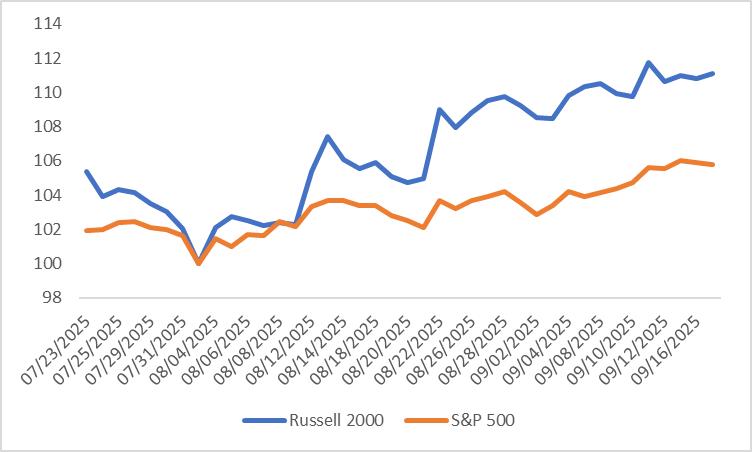
Note: Rebased on 1 August 2025 = 100
Source: Refinitiv, TradingKey
* For related information, refer to the article published on 15 September 2025, titled “Will the Fed’s Rate Cut Trigger a Stock Market Drop Instead of a Rally?”
2. Fed Rate Cuts
2.1 Theoretically, Rate Cuts are More Beneficial to Small-Cap Stocks
It is widely recognised that the Federal Reserve plays a pivotal role in shaping U.S. stock market trends. In theory, small-cap stocks benefit more than large-cap stocks during a rate-cutting cycle for three primary reasons:
First, small-cap companies typically rely more heavily on external financing, whereas large-cap firms often boast stronger cash flows and internal funding sources. Rate cuts lower borrowing costs, enabling small-caps to reduce interest expenses, enhance profitability, and more readily secure capital for expansion. Second, rate cuts are generally designed to stimulate economic growth. Small-cap stocks are more tied to U.S. domestic cycles, as they are predominantly domestic enterprises with limited exposure to global factors. During an economic recovery, their revenues and profits tend to accelerate faster. Third, Federal Reserve rate cuts frequently steepen the yield curve, with short-term Treasury yields falling more sharply than long-term ones. A steeper curve signals optimistic economic prospects, from which small-cap stocks—as higher-risk assets—stand to gain disproportionately.
2.2 The Real World Is More Complex Than Theory
However, real-world economics is far more intricate than economic theory suggests. This complexity primarily manifests in the timing of rate cuts and the sustained impact of the low-interest-rate environment following the end of a rate-cutting cycle on the stock market. Regarding the timing of rate cuts alone, such cycles rarely unfold straightforwardly; instead, they often exhibit a start-pause-restart pattern. For example:
· January 2001–December 2001 rate-cutting cycle, with a pause in July 2001;
· November 2002–June 2003 rate-cutting cycle, with a pause from December 2002 to May 2003;
· September 2007–December 2008 rate-cutting cycle, with a pause from May 2008 to September 2008;
· July 2019–March 2020 rate-cutting cycle, with a pause from November 2019 to February 2020.
2.3 The Early Phase of the Rate-Cutting Cycles
For analytical clarity, we define the period before a pause in rate cuts as the "early phase" and the period after as the "later phase." During the early phase, influenced by slowing economic growth or even crises, the Federal Reserve initiates rate cuts. At this stage, two opposing forces shape the U.S. stock market: first, downward pressure from economic slowdowns, and second, upward support from the liquidity unleashed by rate reductions.
Historical data indicate that the relative strength of these two forces shapes U.S. stock market performance. For example, during the rate-cutting cycles beginning in January 2001 and September 2007, both large-cap and small-cap stocks declined. Conversely, in the cycles starting in November 2002 and July 2019, both market segments recorded gains.
2.4 The Later Phase of the Rate-Cutting Cycles
During the later phase of the rate-cutting cycle, the economic outlook in the U.S. has typically improved due to earlier rate cuts, reducing downward pressure on the stock market. As the later phase begins and low interest rates are sustained, the supportive force from liquidity generally takes precedence in most cases.
Historical data aligns with the three economic principles outlined earlier, showing that small-cap stocks outperform large-cap stocks in the later phase of rate-cutting cycles. This is evident in U.S. stock market performance over the 12 months following the start of the later phase: From June 2003, the Russell 2000 Index surged by 31.9%, nearly double the S&P 500’s gain over the same period. From March 2020, the Russell 2000 achieved a remarkable 92.6% return, significantly outpacing the S&P 500’s 29% return. From October 2008, the Russell 2000’s return turned positive, while the S&P 500 remained in negative territory.
However, from August 2001 to July 2002, the lingering effects of the dot-com bubble crash impacted the later phase of the rate-cutting cycle, leading to declines in both indices. The Russell 2000 recorded a return of -16.6%, while the S&P 500 fell by -24.7%. Mathematically speaking, small-cap stocks still outperformed large-cap stocks during this period, as their decline was relatively smaller.
2.5 Looking Back at the Present, Looking Forward to the Future
Looking back at the present, the Federal Reserve navigated the early phase of its rate-cutting cycle from September to December 2024, reducing the policy rate by a cumulative 100 basis points. After an eight-month pause, with U.S. inflation remaining within expected and manageable levels, the Fed resumed the later phase of the rate-cutting cycle in September 2025. If the three economic principles outlined earlier remain valid, we expect history to repeat itself. Consequently, over the next 12 months, the Russell 2000 Index is likely to outperform the S&P 500 Index.
Figure 2.1: S&P 500 and Russell 2000 Returns in the Early and Later Phases During Fed's Rate Cut Cycles
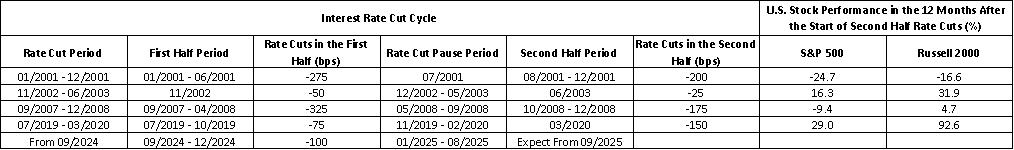
Source: Refinitiv, TradingKey
Figure 2.2: Performance of the S&P 500 and Russell 2000 Indices
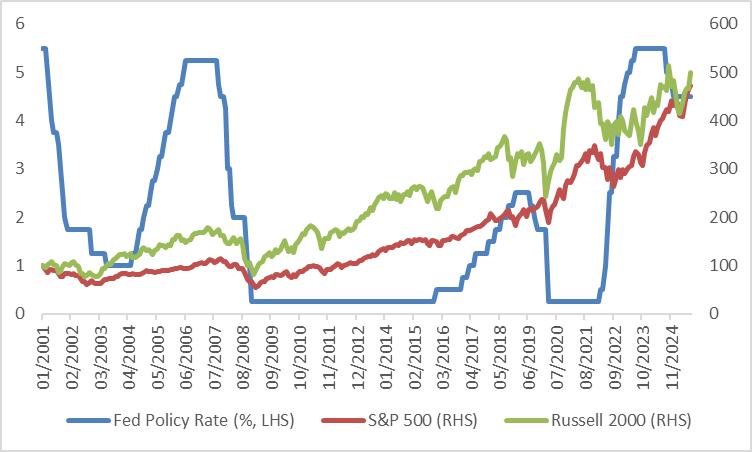
Note: Rebased in January 2001 = 100
Source: Refinitiv, TradingKey
3. Portfolio Rebalancing
Beyond Federal Reserve policy, portfolio rebalancing by investors could serve as another catalyst for the Russell 2000 Index to outperform the S&P 500 Index. Currently, the market is concerned about whether leading companies in the artificial intelligence (AI) sector can deliver higher returns. Goldman Sachs estimates that tech giants will invest over $1 trillion in AI capital expenditures in the coming years. However, AI has yet to develop solutions for complex problems, making it challenging for companies to achieve sufficient returns. These concerns may trigger capital outflows from tech giants. The two largest sectors in the Russell 2000 Index are Financials and Health Care, collectively accounting for approximately 35% of the index. As a result, some of the capital outflows may flow into these small-cap stocks.
4. Valuations
As of 17 September 2025, the Russell 2000’s price-to-earnings (P/E) ratio stands at 18.07, significantly lower than the S&P 500’s P/E ratio of 27.16 (Figures 3.1 and 3.2). This suggests that small-cap stocks are relatively cheaper than large-cap stocks, making them more attractive to investors. However, this assessment is relative. When comparing the Russell 2000’s current P/E ratio to its historical data, U.S. small-cap stocks show no signs of being undervalued—the current P/E ratio not only exceeds its five-year historical average but is also approaching two standard deviations above it. Therefore, we conclude that valuations are unlikely to be a primary driver of upside for the Russell 2000.
Figure 3.1: Russell 2000 P/E Ratio
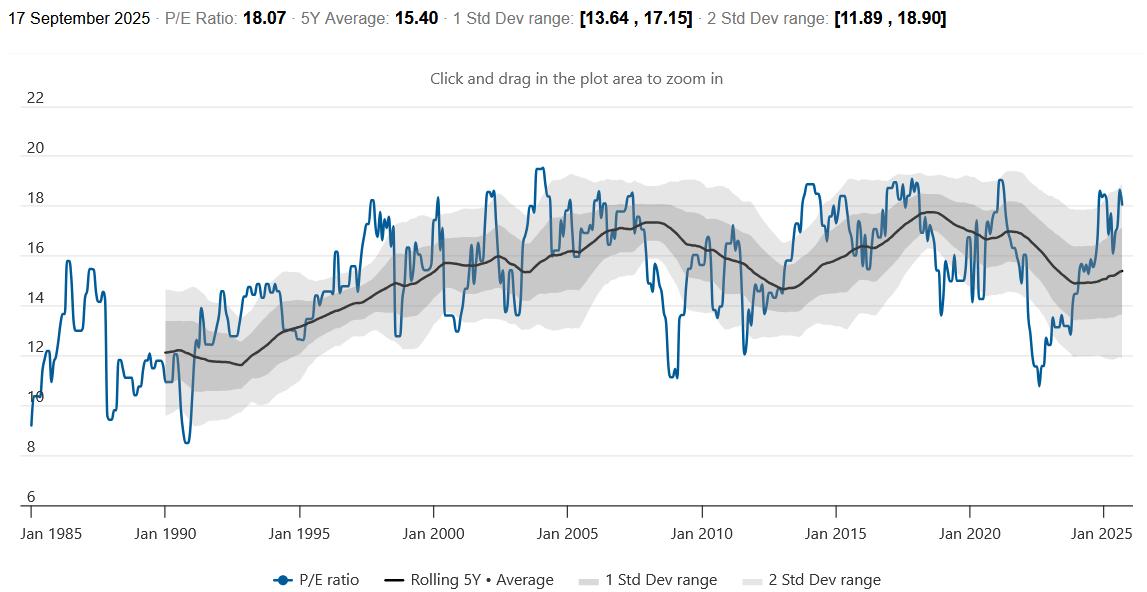
Source: World PE Ratio, TradingKey
Figure 3.2: S&P 500 P/E Ratio
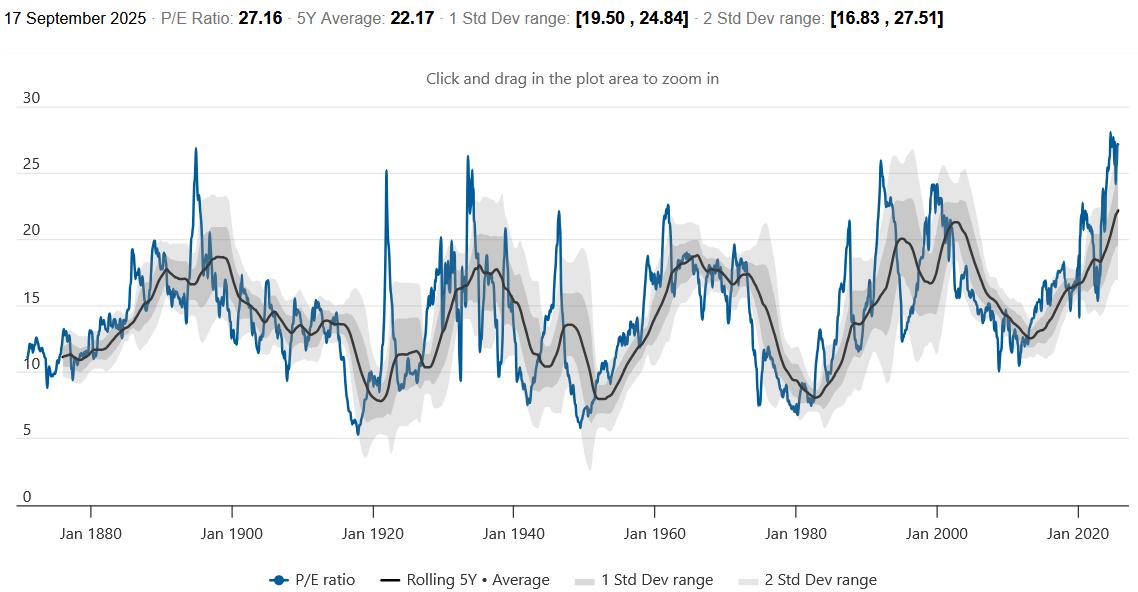
Source: World PE Ratio, TradingKey
5. Risks
U.S. inflation levels represent the primary risk factor for the market. The core Personal Consumption Expenditures (PCE) price index, a key inflation metric monitored by the Federal Reserve, reached a low of 2.5% in April 2025 but has since shown a consistent month-on-month increase. If this index rises more than expected in the coming months, the Fed may be compelled to scale back its rate cuts or even pause them again. In such a scenario, both the Russell 2000 and S&P 500 could face bearish conditions.
6. Conclusion
On 17 September 2025, the Federal Reserve lowered its benchmark interest rate by 25 basis points to a range of 4.00%–4.25%. This range remains historically elevated, indicating that the Fed has ample room for further rate cuts to support economic growth and stabilise financial markets. We anticipate that by the end of 2025, the Fed may implement two additional rate cuts, each by 25 basis points. If this forecast materialises, U.S. stock prices are likely to rise, with the Russell 2000 Index expected to outperform the S&P 500 Index.
Notably, the Russell 2000 Index covers U.S.-listed companies ranked from 1,001st to 3,000th. Individual companies within this index typically carry a low weight in the overall index, generally less than 1%. Among them, top-ranked constituents include Credo Technology, Bloom Energy, IONQ, and so on. In terms of sector distribution, the financial and healthcare sectors account for relatively larger proportions of the index, while the utilities and telecommunications sectors have smaller weightings. For investors seeking exposure to the entire Russell 2000 Index, key products to consider are the iShares Russell 2000 ETF (IWM) and the Vanguard Russell 2000 ETF (VTWO). Those focusing on the growth segment may look into the iShares Russell 2000 Growth ETF (IWO) and the Vanguard Russell 2000 Growth ETF (VTWG). For value-oriented investors, the iShares Russell 2000 Value ETF (IWN) and the Vanguard Russell 2000 Value ETF (VTWV) are viable options.

Get Started
Recommended Articles


