
US GDP is expected to bounce up in Q2, buoyed by resilient consumption
- The US GDP is seen expanding at an annualised 2.5% rate in Q2.
- Investors will analyse the data from a monetary policy perspective.
- The US Dollar needs a strong release to take off from multi-year lows.
The United States (US) Bureau of Economic Analysis (BEA) is set to publish its preliminary estimate of second-quarter Gross Domestic Product (GDP) on Wednesday at 12:30 GMT. Analysts are expecting the data to show annualized growth of 2.5%, following the 0.5% contraction seen in the first three months of the year.
Markets expect a solid GDP report to eliminate stagflationary fears
One of the main highlights in this week’s economic calendar is the US’s second-quarter preliminary GDP figures, widely considered the most market-moving estimate of the three issued each quarter. The GDP will be released a few hours ahead of the Federal Reserve’s (Fed) interest rate decision, and is likely to have some impact on the central bank’s monetary policy stance.
After the unexpected economic contraction seen in the first three months of the year, investors will be particularly attentive to the extent of the economic rebound in the second quarter. A steady labor market has contributed to keeping healthy consumption levels, while the tariff outlook is starting to clarify. Traders are eager to forget the stagflationary fears that gripped markets earlier this year.
Wednesday’s Gross Domestic Product report will frame the Federal Reserve’s monetary policy decision, due a few hours later on the same day. The bank will, highly likely, keep interest rates on hold, but markets will be attentive to spot any change in the bank’s stance, and more specifically, on the chances of a rate cut in September.Together with the economic performance data, the Bureau of Economic Analysis releases the GDP Price Index – also known as the GDP deflator – which measures inflation across all domestically produced goods and services, including exports but excluding imports. This is expected to have moderated to 2.4% in the second quarter from the 3.8% reading seen in the previous one. These figures are important because they remove the effect of inflation, allowing for a more accurate assessment of real growth.
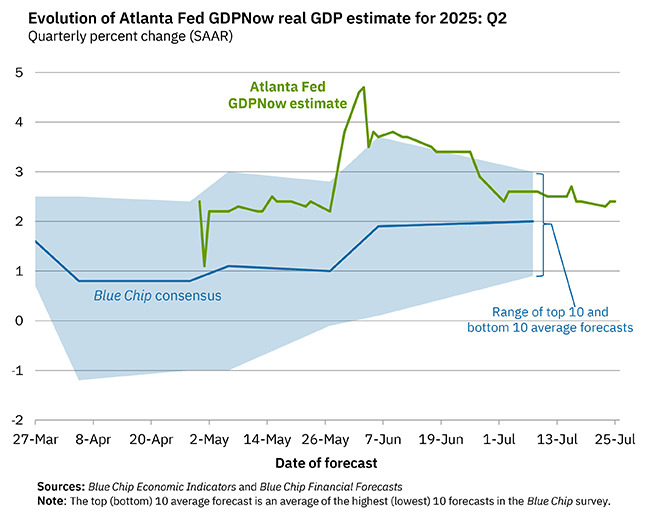
In the same line, the Atlanta Fed’s GDPNow model – closely watched for its real-time tracking of economic activity – foresees a 2.4% growth in Q2 GDP as of its July 25 update.
When will the Gross Domestic Product print be released, and how can it affect the US Dollar Index?
The US GDP report, due at 12:30 GMT on Wednesday, might have a significant impact on the US Dollar (USD). Investors need hard data to consolidate the positive feelings triggered by recent macroeconomic releases and certify that the economy is out of the woods as trade uncertainty starts to dissipate.
The US Dollar is likely to be more sensitive to a strong GDP reading than to a lower-than-expected one. A strong economic performance, combined with a robust labor market and with business activity accelerating, would provide a favourable fundamental background to the US Dollar’s recovery. Bear in mind, however, that the immediate market reaction might be limited, as markets might wait for the Fed to make investment decisions.
The most positive combination for the US Dollar would be a strong GDP reading and a hawkish Fed. Not an unlikely scenario. With the economy growing at 2.5% or higher, and consumer inflation closer to 3% than to the Fed’s 2% target, the Fed Chairman Jerome Powell is unlikely to hint at the September interest rate cut the market is wishing for.
This might give the US Dollar the necessary impulse to take off from the year lows and create the conditions for a deeper bullish reversal. A lower-than-expected reading, on the contrary, might keep hopes of a September cut alive and keep the US Dollar recovery limited.
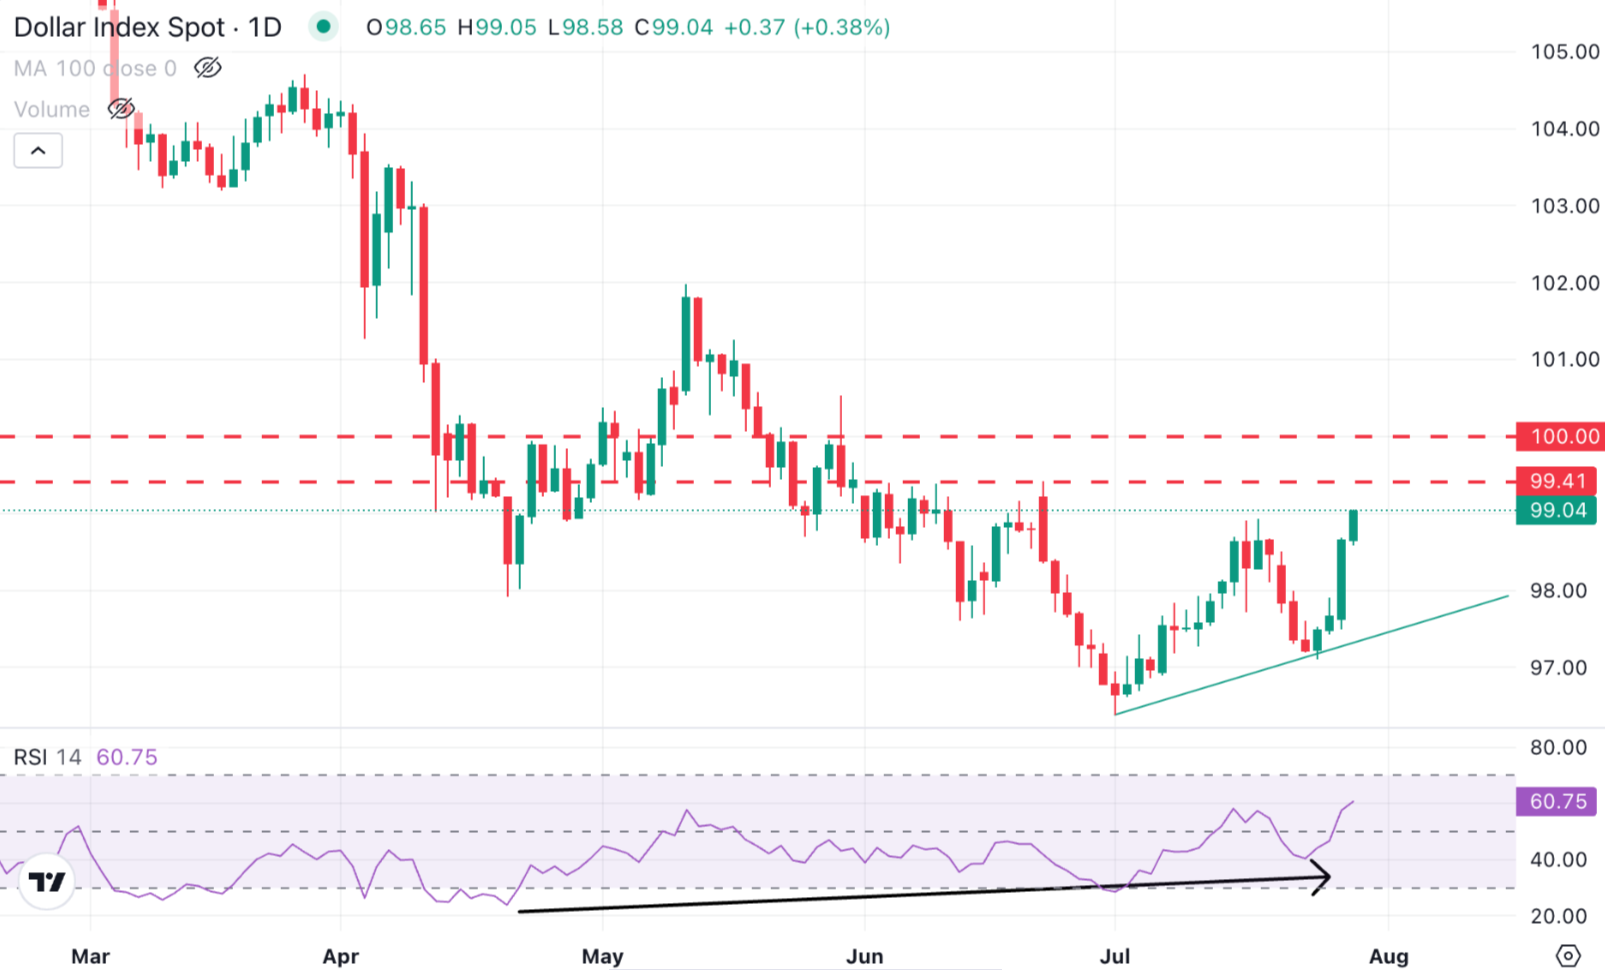
The broader US Dollar Index (DXY) technical outlook remains bearish, but the immediate bias is showing signs of a potential bottom, after having depreciated about 12% from January´s high to July’s bottom.
Technically, a higher low in late July combined with a bullish divergence and the improving bullish momentum seen on the daily Relative Strength Index (RSI) and the MACD indicators suggest that the downtrend has exhausted and that the US Dollar might be ready for a deeper recovery.
Bulls, however, need to breach the mid-July highs, at the 99.00 area, to confirm a trend shift, and set sail to 99.40, where the index was limited on June 10 and June 23, ahead of the psychological 100.00 level.
On the downside, the July 24 low, at 97.10, is a key level to defend the multi-year low of 96.40 hit in early July, keeping US Dollar recovery attempts alive. A bearish reaction below these levels might target the 161% Fibonacci retracement of the April-May recovery, at 95.40.
GDP FAQs
A country’s Gross Domestic Product (GDP) measures the rate of growth of its economy over a given period of time, usually a quarter. The most reliable figures are those that compare GDP to the previous quarter e.g Q2 of 2023 vs Q1 of 2023, or to the same period in the previous year, e.g Q2 of 2023 vs Q2 of 2022. Annualized quarterly GDP figures extrapolate the growth rate of the quarter as if it were constant for the rest of the year. These can be misleading, however, if temporary shocks impact growth in one quarter but are unlikely to last all year – such as happened in the first quarter of 2020 at the outbreak of the covid pandemic, when growth plummeted.
A higher GDP result is generally positive for a nation’s currency as it reflects a growing economy, which is more likely to produce goods and services that can be exported, as well as attracting higher foreign investment. By the same token, when GDP falls it is usually negative for the currency. When an economy grows people tend to spend more, which leads to inflation. The country’s central bank then has to put up interest rates to combat the inflation with the side effect of attracting more capital inflows from global investors, thus helping the local currency appreciate.
When an economy grows and GDP is rising, people tend to spend more which leads to inflation. The country’s central bank then has to put up interest rates to combat the inflation. Higher interest rates are negative for Gold because they increase the opportunity-cost of holding Gold versus placing the money in a cash deposit account. Therefore, a higher GDP growth rate is usually a bearish factor for Gold price.
Economic Indicator
Gross Domestic Product Annualized
The real Gross Domestic Product (GDP) Annualized, released quarterly by the US Bureau of Economic Analysis, measures the value of the final goods and services produced in the United States in a given period of time. Changes in GDP are the most popular indicator of the nation’s overall economic health. The data is expressed at an annualized rate, which means that the rate has been adjusted to reflect the amount GDP would have changed over a year’s time, had it continued to grow at that specific rate. Generally speaking, a high reading is seen as bullish for the US Dollar (USD), while a low reading is seen as bearish.
Read more.Next release: Wed Jul 30, 2025 12:30 (Prel)
Frequency: Quarterly
Consensus: 2.4%
Previous: -0.5%
Source: US Bureau of Economic Analysis
The US Bureau of Economic Analysis (BEA) releases the Gross Domestic Product (GDP) growth on an annualized basis for each quarter. After publishing the first estimate, the BEA revises the data two more times, with the third release representing the final reading. Usually, the first estimate is the main market mover and a positive surprise is seen as a USD-positive development while a disappointing print is likely to weigh on the greenback. Market participants usually dismiss the second and third releases as they are generally not significant enough to meaningfully alter the growth picture.
Recommended Articles


