

Dogecoin Price Prediction: Why DOGE traders moved $200M within 24 hours of Trump’s car tariffs announcement
- Dogecoin price tumbles below $0.20 on Thursday, down 2.4% from its 24-hour peak.
- Trump announced a 25% tax on auto imports, triggering a negative impact on Elon Musk-linked assets, including Tesla and DOGE.
- Traders closed over $200 million in DOGE futures contracts, driving open interest below $2 billion.
DOGE tumbles 4% as Trump’s auto tariffs tank assets linked to Elon Musk
Dogecoin (DOGE) has experienced sharp price swings over the past two trading days, driven by contrasting statements from United States (US) President Donald Trump. Market reactions to Trump’s comments have moved DOGE prices in opposite directions, contributing to heightened volatility.
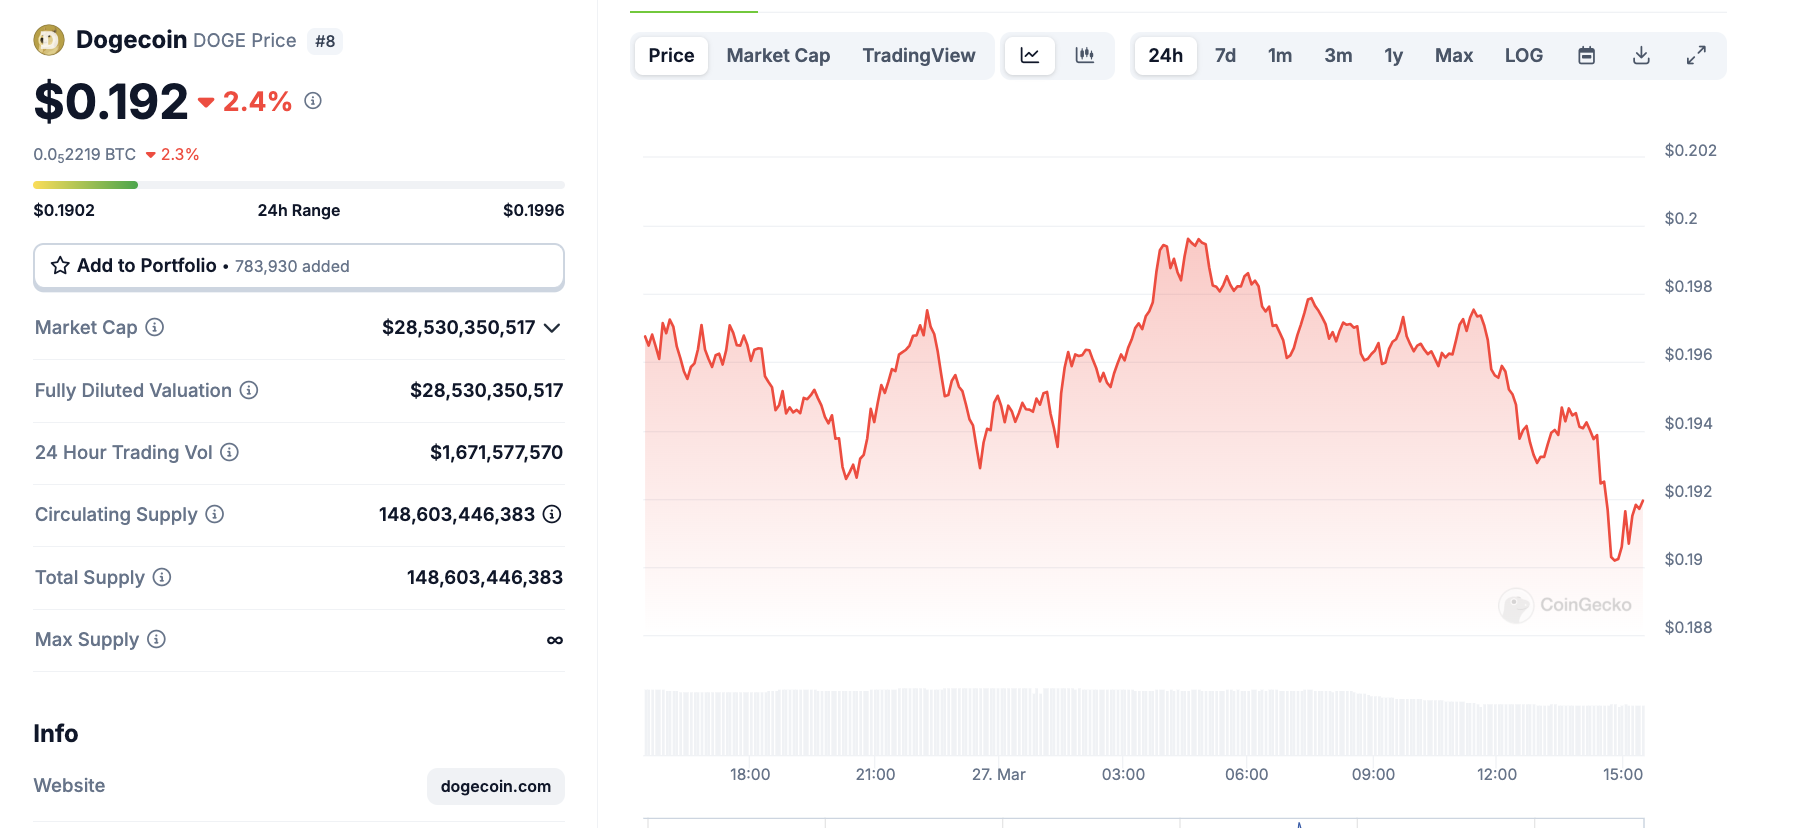 Dogecoin price action, March 27 | Source: Coingecko
At press time, DOGE is trading below the $0.19 level, posting a 2.4% decline, according to CoinGecko data.
Why is Dogecoin price down today?
On Monday, Trump reaffirmed his support for the official TRUMP meme token, sparking a rally across the altcoin market. Memecoins like DOGE, PEPE, and SHIB all surged by over 5%, pushing the total market capitalization of the memecoin sector above $62 billion by Tuesday.
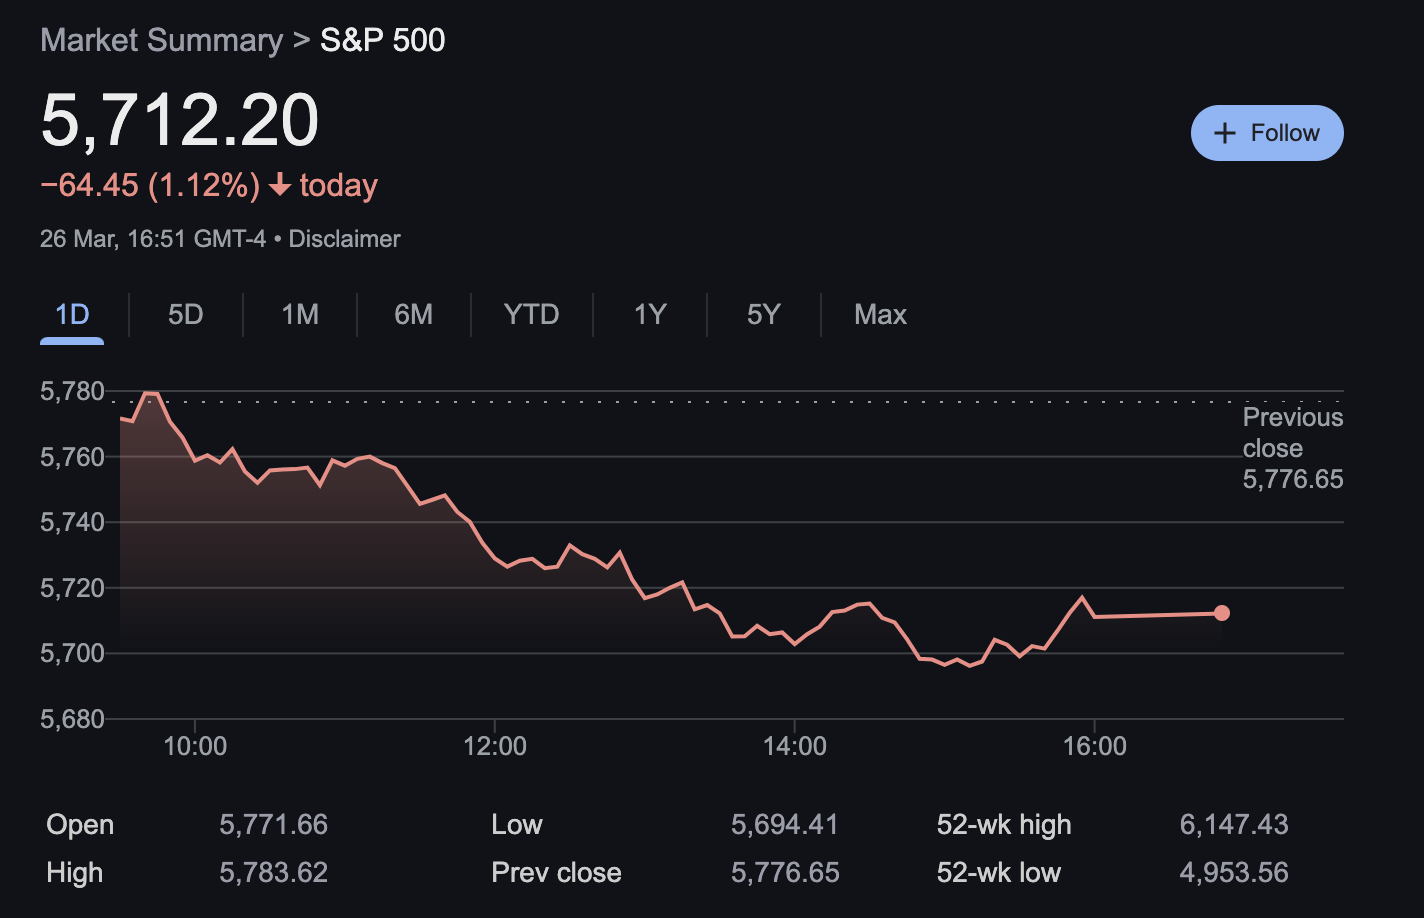 Tesla (TSLA) stock price performance after Trump confirmed auto tarrifs on Wednesday | Source: NASDAQ
However, the momentum reversed on Wednesday after Trump announced a 25% tariff on car imports starting April 2.
According to BBC reports, Elon Musk confirmed that the policy could significantly impact Tesla’s bottom line.
This triggered major sell-offs in assets linked to Musk, including Tesla stock, which dropped 5% within 24 hours of the announcement, a 6% rebound when markets opened on Thursday
Given Musk’s well-documented ties to the Dogecoin community, DOGE’s rally quickly lost steam, resulting in a sharp 2.4% decline by Thursday.
Trump tariffs introduce fresh volatility risks, Dogecoin open interest drops under $2 billion
Dogecoin’s 2.4% price decline on Thursday reflects bearish sentiment surrounding assets linked to Elon Musk, as markets digest the economic impact of Trump’s newly proposed tariffs.
A deeper dive into Dogecoin’s derivatives data reveals that traders are actively pulling capital from the market, signaling increased caution amid rising volatility risks.
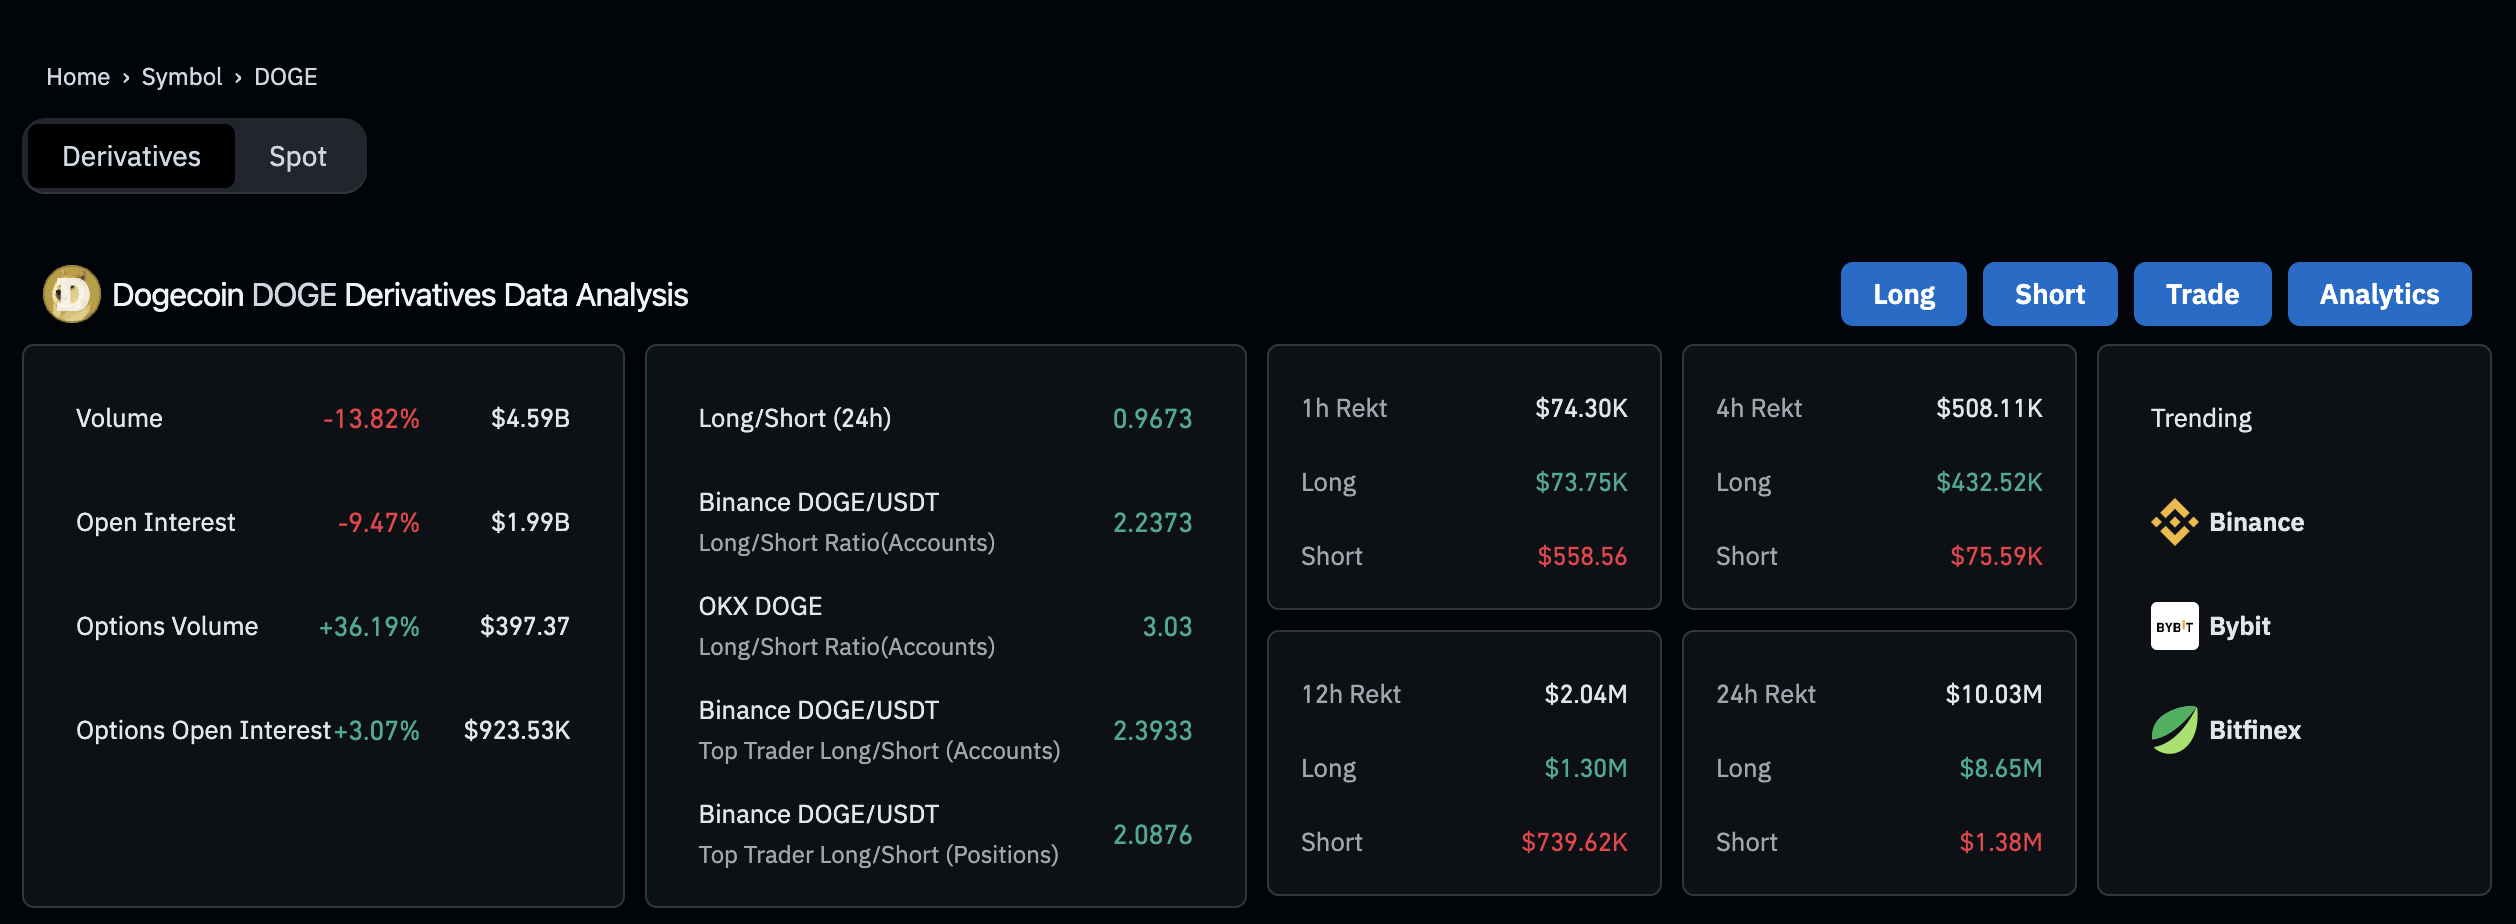 Dogecoin derivatives markets analysis, March 27 | Source: Coinglass
According to the latest Coinglass data, Dogecoin’s open interest has plunged by 9.47% to $1.99 billion, even as its price dipped only 4%.
This disparity suggests that traders are closing out leveraged positions at a faster rate than the price decline, indicating a lack of confidence in DOGE’s near-term recovery.
When open interest drops significantly faster than price, it typically signals weakening market participation and reduced speculative interest, increasing the likelihood of continued downside.
Additional bearish signals reinforce this outlook. The overall volume has declined by 13.82% to $4.59 billion, showing reduced trading activity and liquidity.
Meanwhile, the 24-hour long/short ratio stands at 0.9673, meaning short sellers are gaining ground, further pressuring prices.
The liquidation data also points to weak bullish momentum—over the last 12 hours, long traders have faced $1.3 million in liquidations, while shorts have only lost $739,620, indicating that long positions are being unwound at a higher rate.
With falling open interest, declining volume, and mounting long liquidations, Dogecoin remains vulnerable to further downside unless market conditions stabilize or fresh bullish catalysts emerge.
DOGE price forecast: $0.15 support at risk as bears offload futures positions
Dogecoin price forecast remains at a pivotal juncture as technical indicators flash mixed signals. At press time, DOGE has tumbled below the psychological support level of $0.20 as sellers regained control following a recent rally.
In terms of the next directional movement, the Donchian Channel suggests that DOGE is struggling to maintain bullish momentum, with the upper band at $0.20585 acting as a key resistance level.
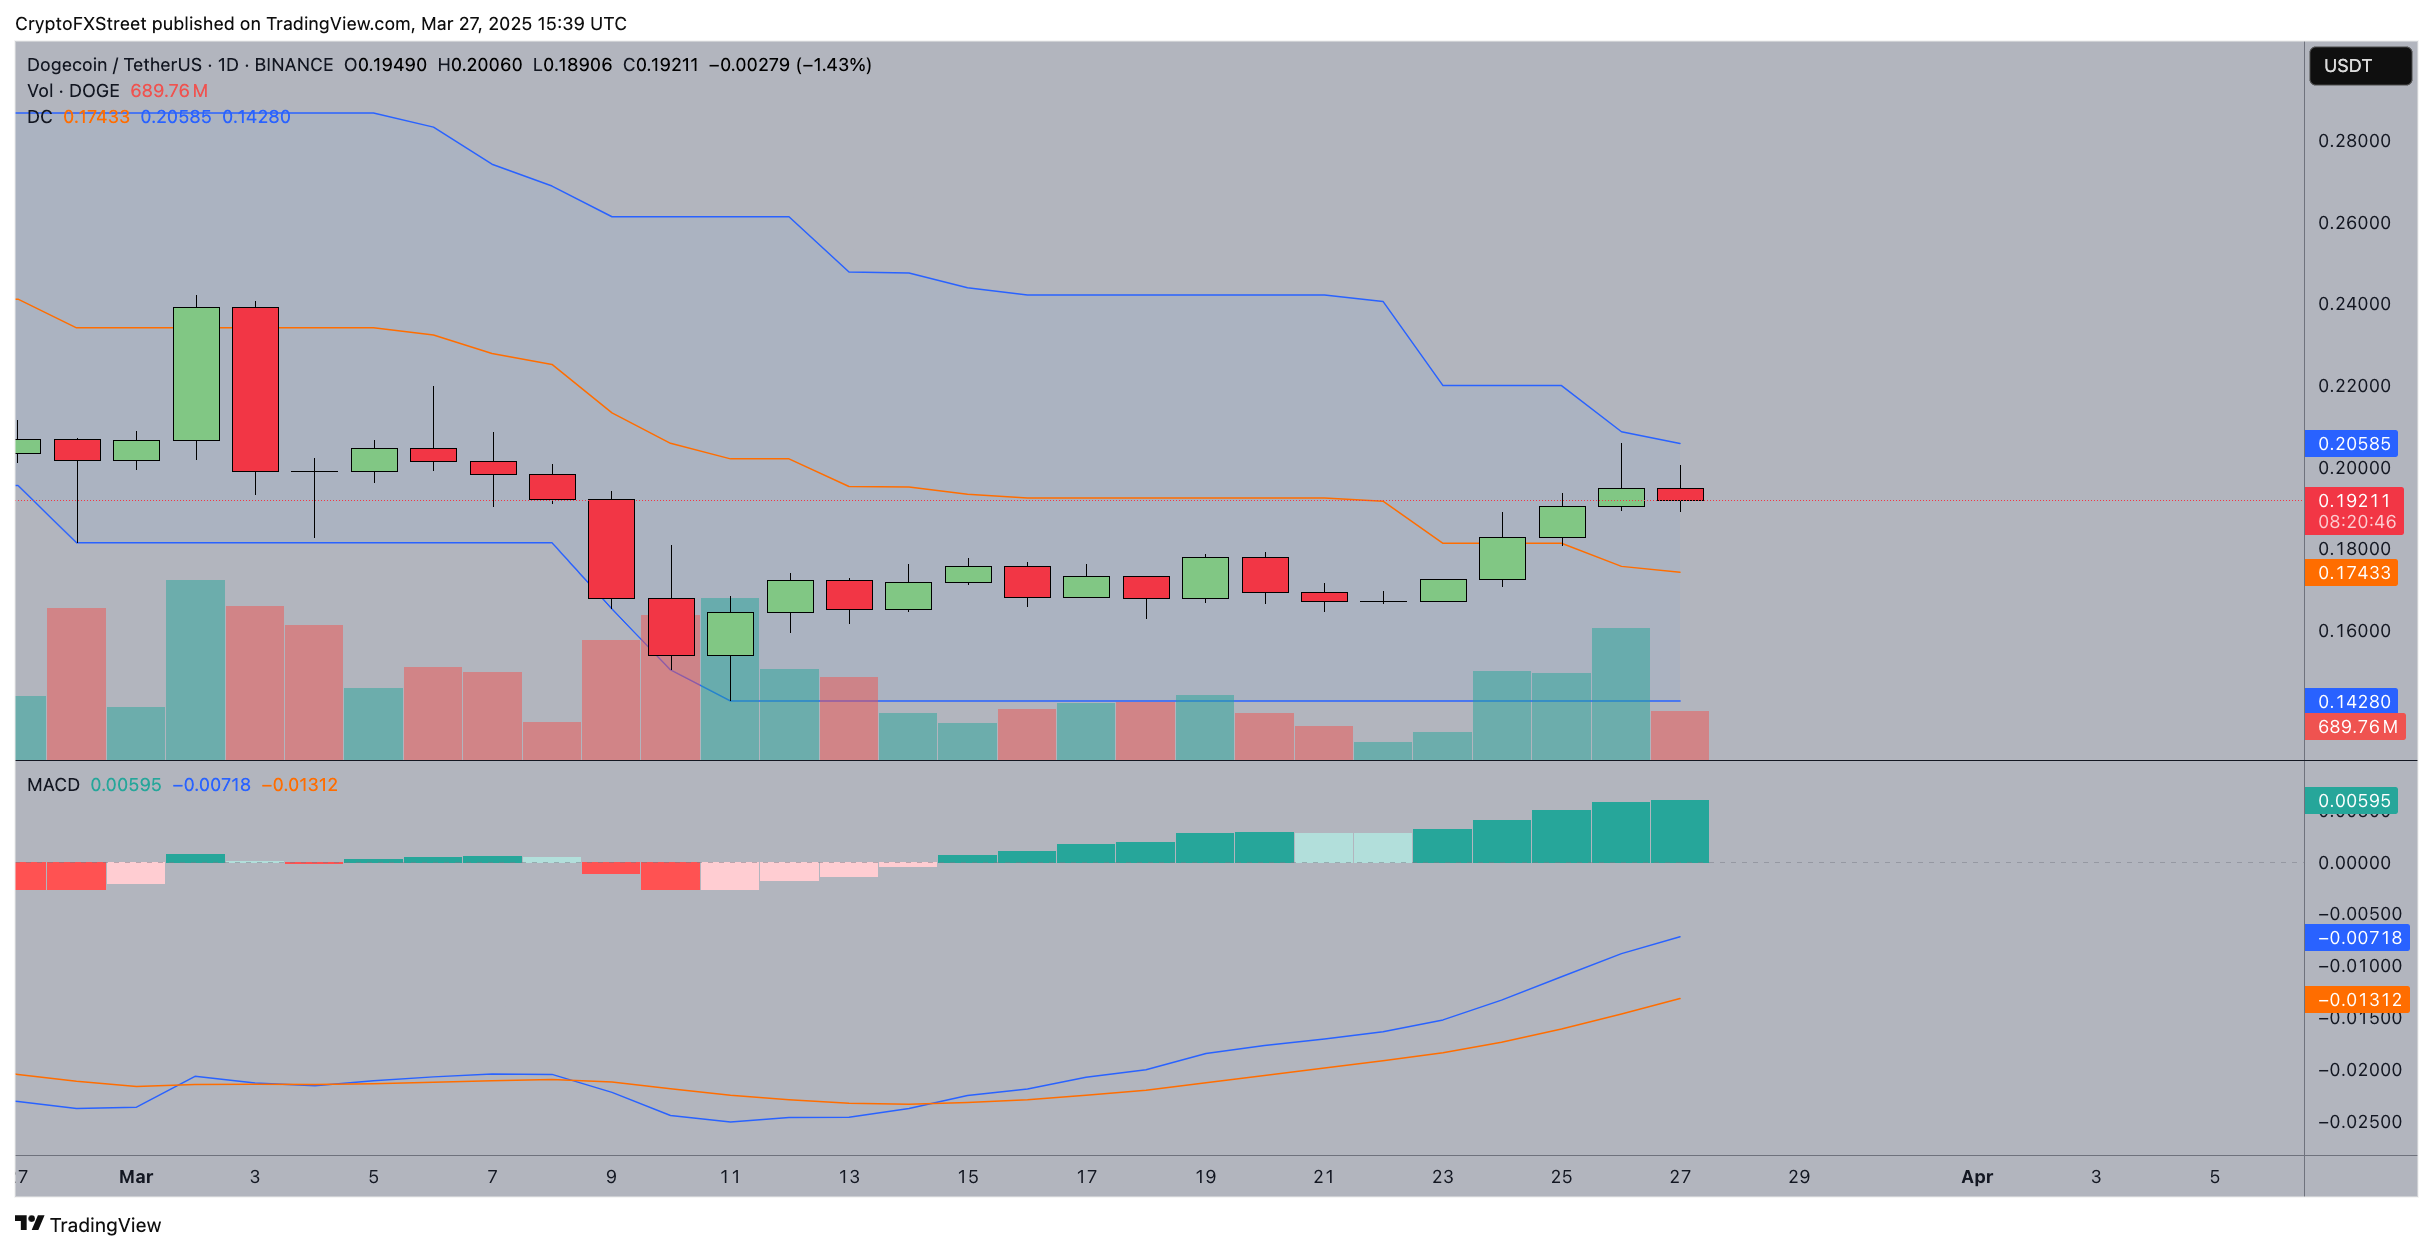
Dogecoin price forecast | DOGEUSD | TradingView
A bearish scenario could unfold if DOGE loses support at $0.17433, triggering a sharp decline toward $0.15.
The MACD histogram, while still in positive territory, shows signs of slowing momentum as the signal line approaches a bearish crossover.
If selling pressure intensifies, DOGE could see further downside fueled by futures traders unwinding long positions.
Conversely, a close above $0.20 could invalidate the bearish outlook, opening the door for a retest of $0.20585 and potentially extending toward $0.22.
However, the weakening trading volume accompanying the red candle on Thursday confirms the growing risk of further downside.
Recommended Articles


