Dogecoin price forecast: Miners offload $240M as DOGE approaches risk zone

Source Fxstreet

Dogecoin market update

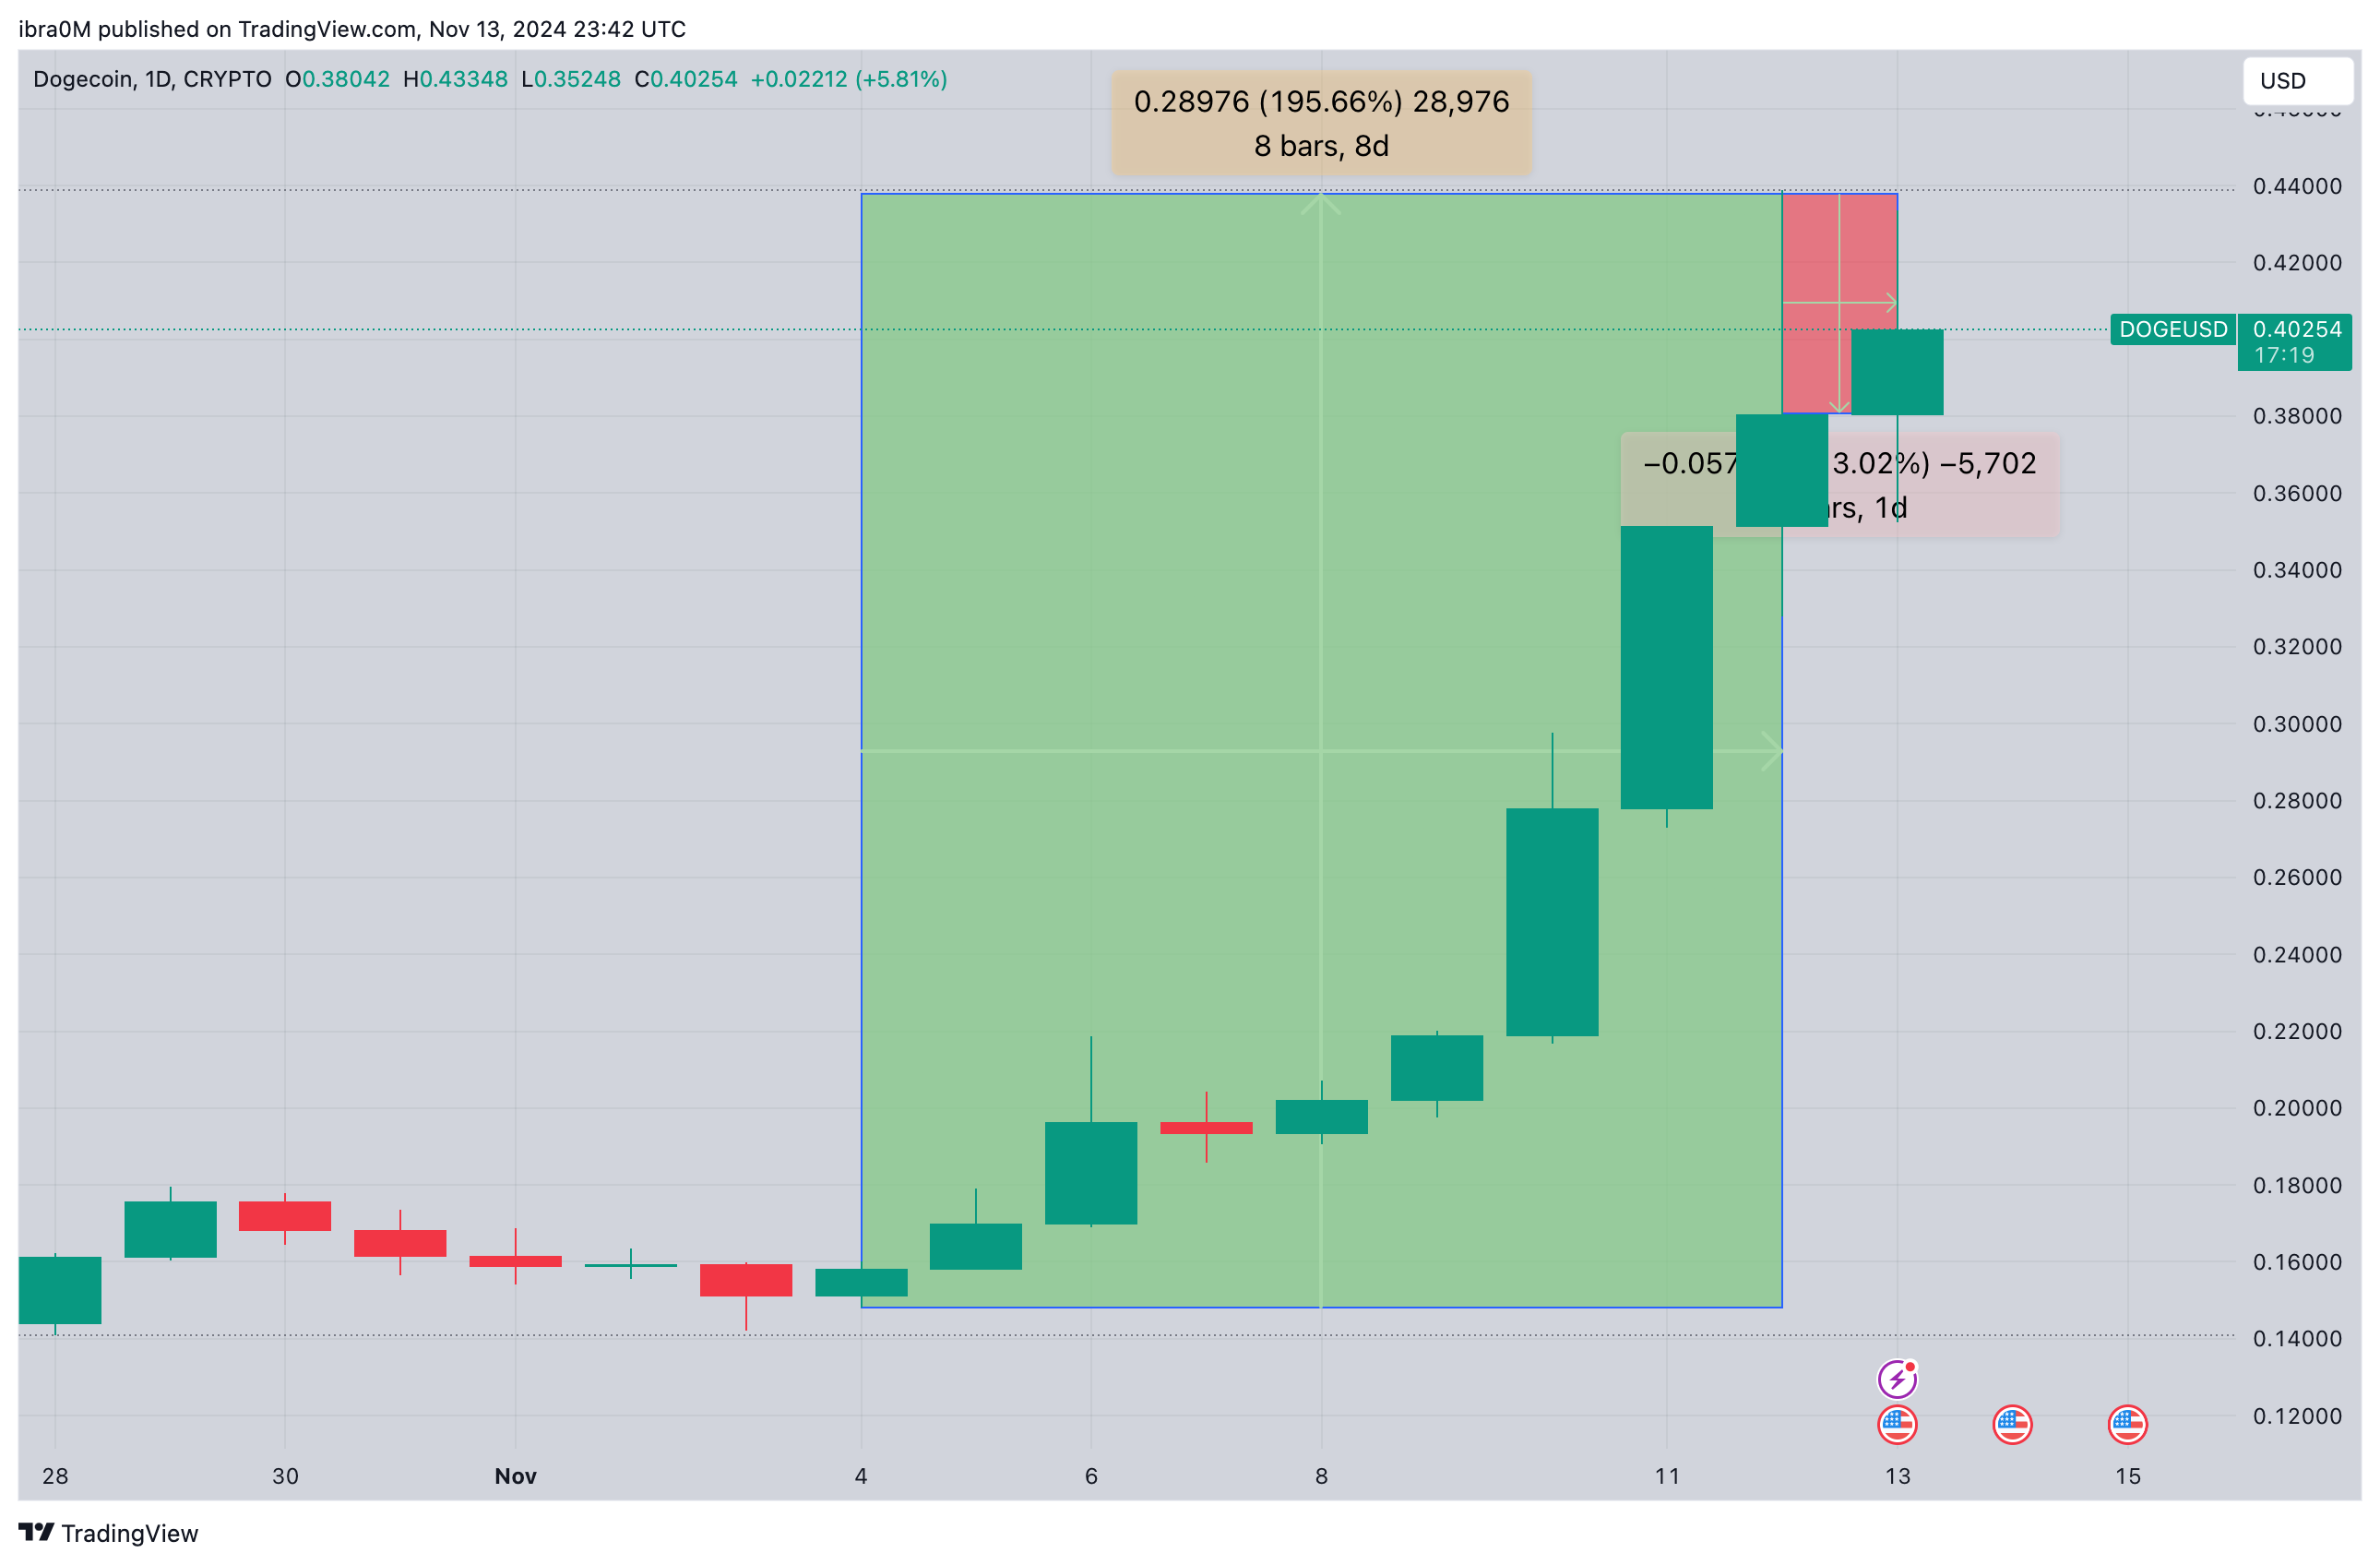
  • After reaching a three-year peak of $0.43 on November 12, Dogecoin price wobbled 13% to find support at the $0.38 level on Wednesday. 
  • Miners capitalized on Trump’s recent D.O.G.E confirmation statement to offload 620 million DOGE in the last three days.
  • Widening Bollinger Bands, and an overbought RSI reading, suggest potential downside risks ahead. 


Dogecoin has dominated the top gainers chart since the start of November, market signals suggest the sentiment could shift in the days ahead. 


Dogecoin price rally cools after Trump confirmed D.O.G.E department 


Since Donald Trump’s victory on November 5, Dogecoin has emerged as the best performing asset among the top 10 ranked cryptocurrencies. On November 12, DOGE reached a new milestone price propelled by Trump’s statement confirming Elon Musk’s involvement in the incoming administration. 

Dogecoin (DOGE) price action November 2024 | TradingView

The DOGEUSD daily chart DOGE price recorded a blistering 195% gains in a frenetic nine-day winning streak. As depicted above, Dogecoin had opened trading at $0.16 on November 5, before making its way to a three-year peak of $0.43 on Wednesday. 

According to Trump’s official statement released, on November 13, billionaire entrepreneur Elon Musk is due to head the Department of Government Efficiency, along with Republican party member Vivek Ramaswamy. 

With all bullish Dogecoin speculations around Trump’s election win now fully priced in, DOGE has begun to flash early signals of buyer fatigue.

At the time of publication on Wednesday November 13, DOGE price entered a 13% correction, finding support at the $0.38 level. 


Miners offloaded 620 million DOGE as market euphoria peaks


Looking beyond the price charts, bullish trading activity among miners is another key factor that has supported the Dogecoin breakout in recent months. But curiously, the Dogecoin miners have now made a major u-turn as market euphoria peaked in the aftermath of Trump’s official statement on Wednesday.

IntoTheBlock’s miners reserves chart below tracks balances held in wallets controlled by recognized miners and mining pools.

 
Notably, in the 25 trading days between Oct 25 and November 9, Dogecoin miners increased their balances by 400 million DOGE, bringing their reserve balances to a 7-month peak of 6.04 billion DOGE. 

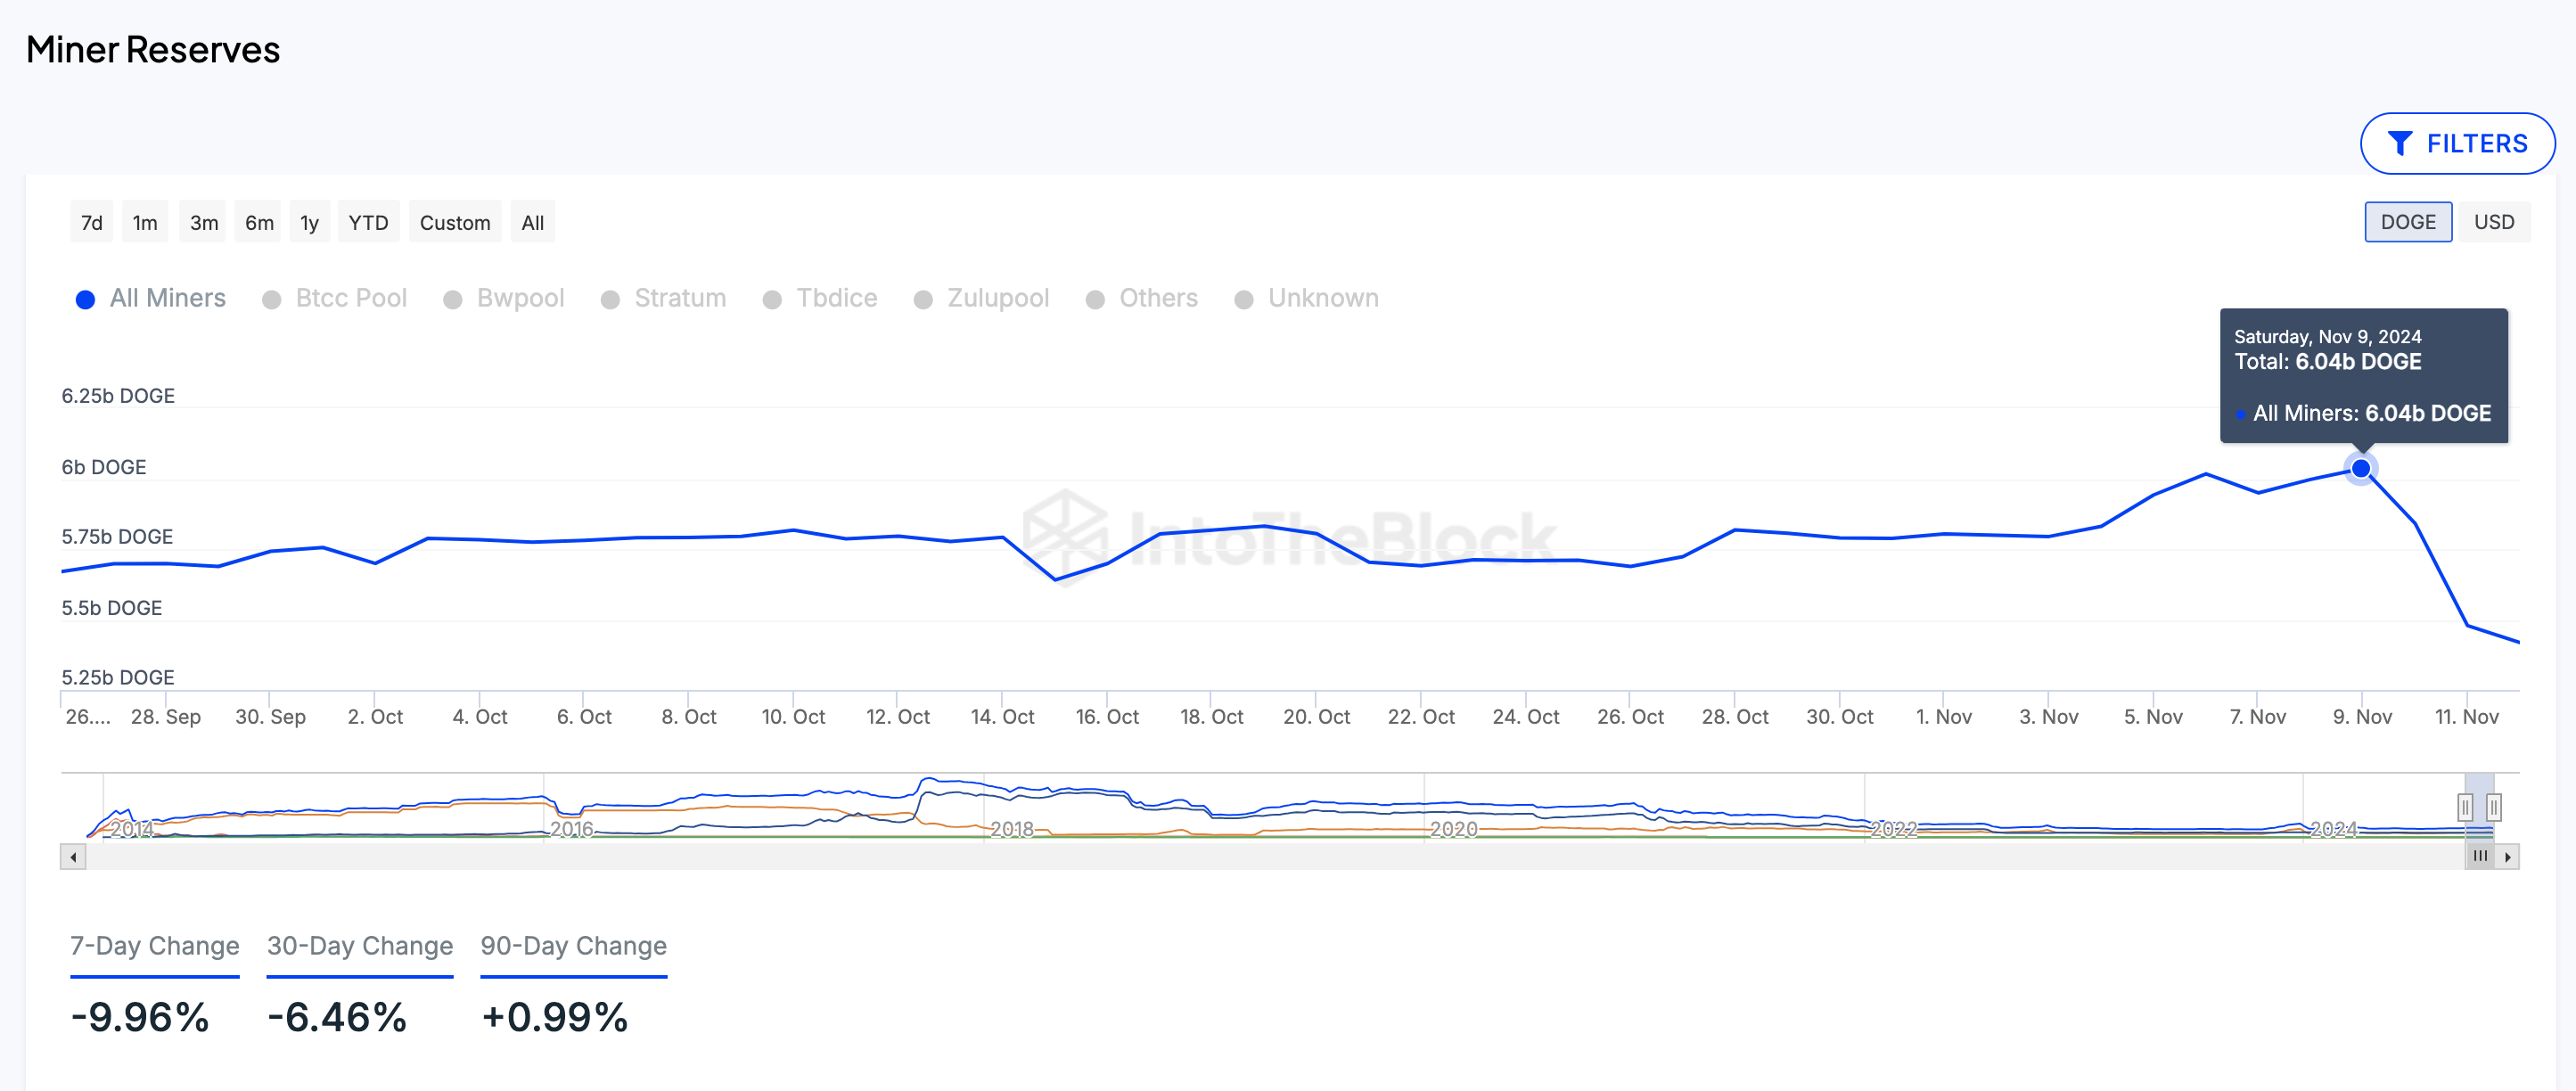
Dogecoin miners reserves | IntoTheBlock

But as the market euphoria peaked this week, miners have entered a major selling spree. The latest data shows that Dogecoin miners now hold just 5.42 billion DOGE at close on November 12.

This reflects that they sold a staggering 620 million DOGE, worth approximately $240 million, in the last three days. 

When miners sell-off surge a large volume of coins after a prolonged accumulation period as observed in the DOGE markets this week, it is interpreted as a bearish signal for two key reasons. 

Firstly, it signals overwhelming expectation among Dogecoin key stakeholders, that the market rally may be approaching a saturation point.

If other traders mirror this sentiment, it could set-off a widespread profit-taking in the days ahead. 

Secondly, miners effectively dilute the existing market supply, when they offload such large volumes newly-mined coins within a short period.

Hence, the $240 million increase in Dogecoin’s short-term market supply over the last 3 days could potentially intensify downward pressure if traders begin to book profits. 

DOGE technical analysis: Failure to hold $0.30 could trigger downward volatility 

Dogecoin price has now dipped 12% since market euphoria peaked when Trump confirmed Elon Musk’s involvement in the D.O.G.E department.

With miners selling off $240 million worth of DOGE in a 3-day selling spree, bears may capitalize to force a major downswing in the near term. 

Technical indicators on the DOGEUSD daily chart below also affirm this cautious Dogecoin forecast.  

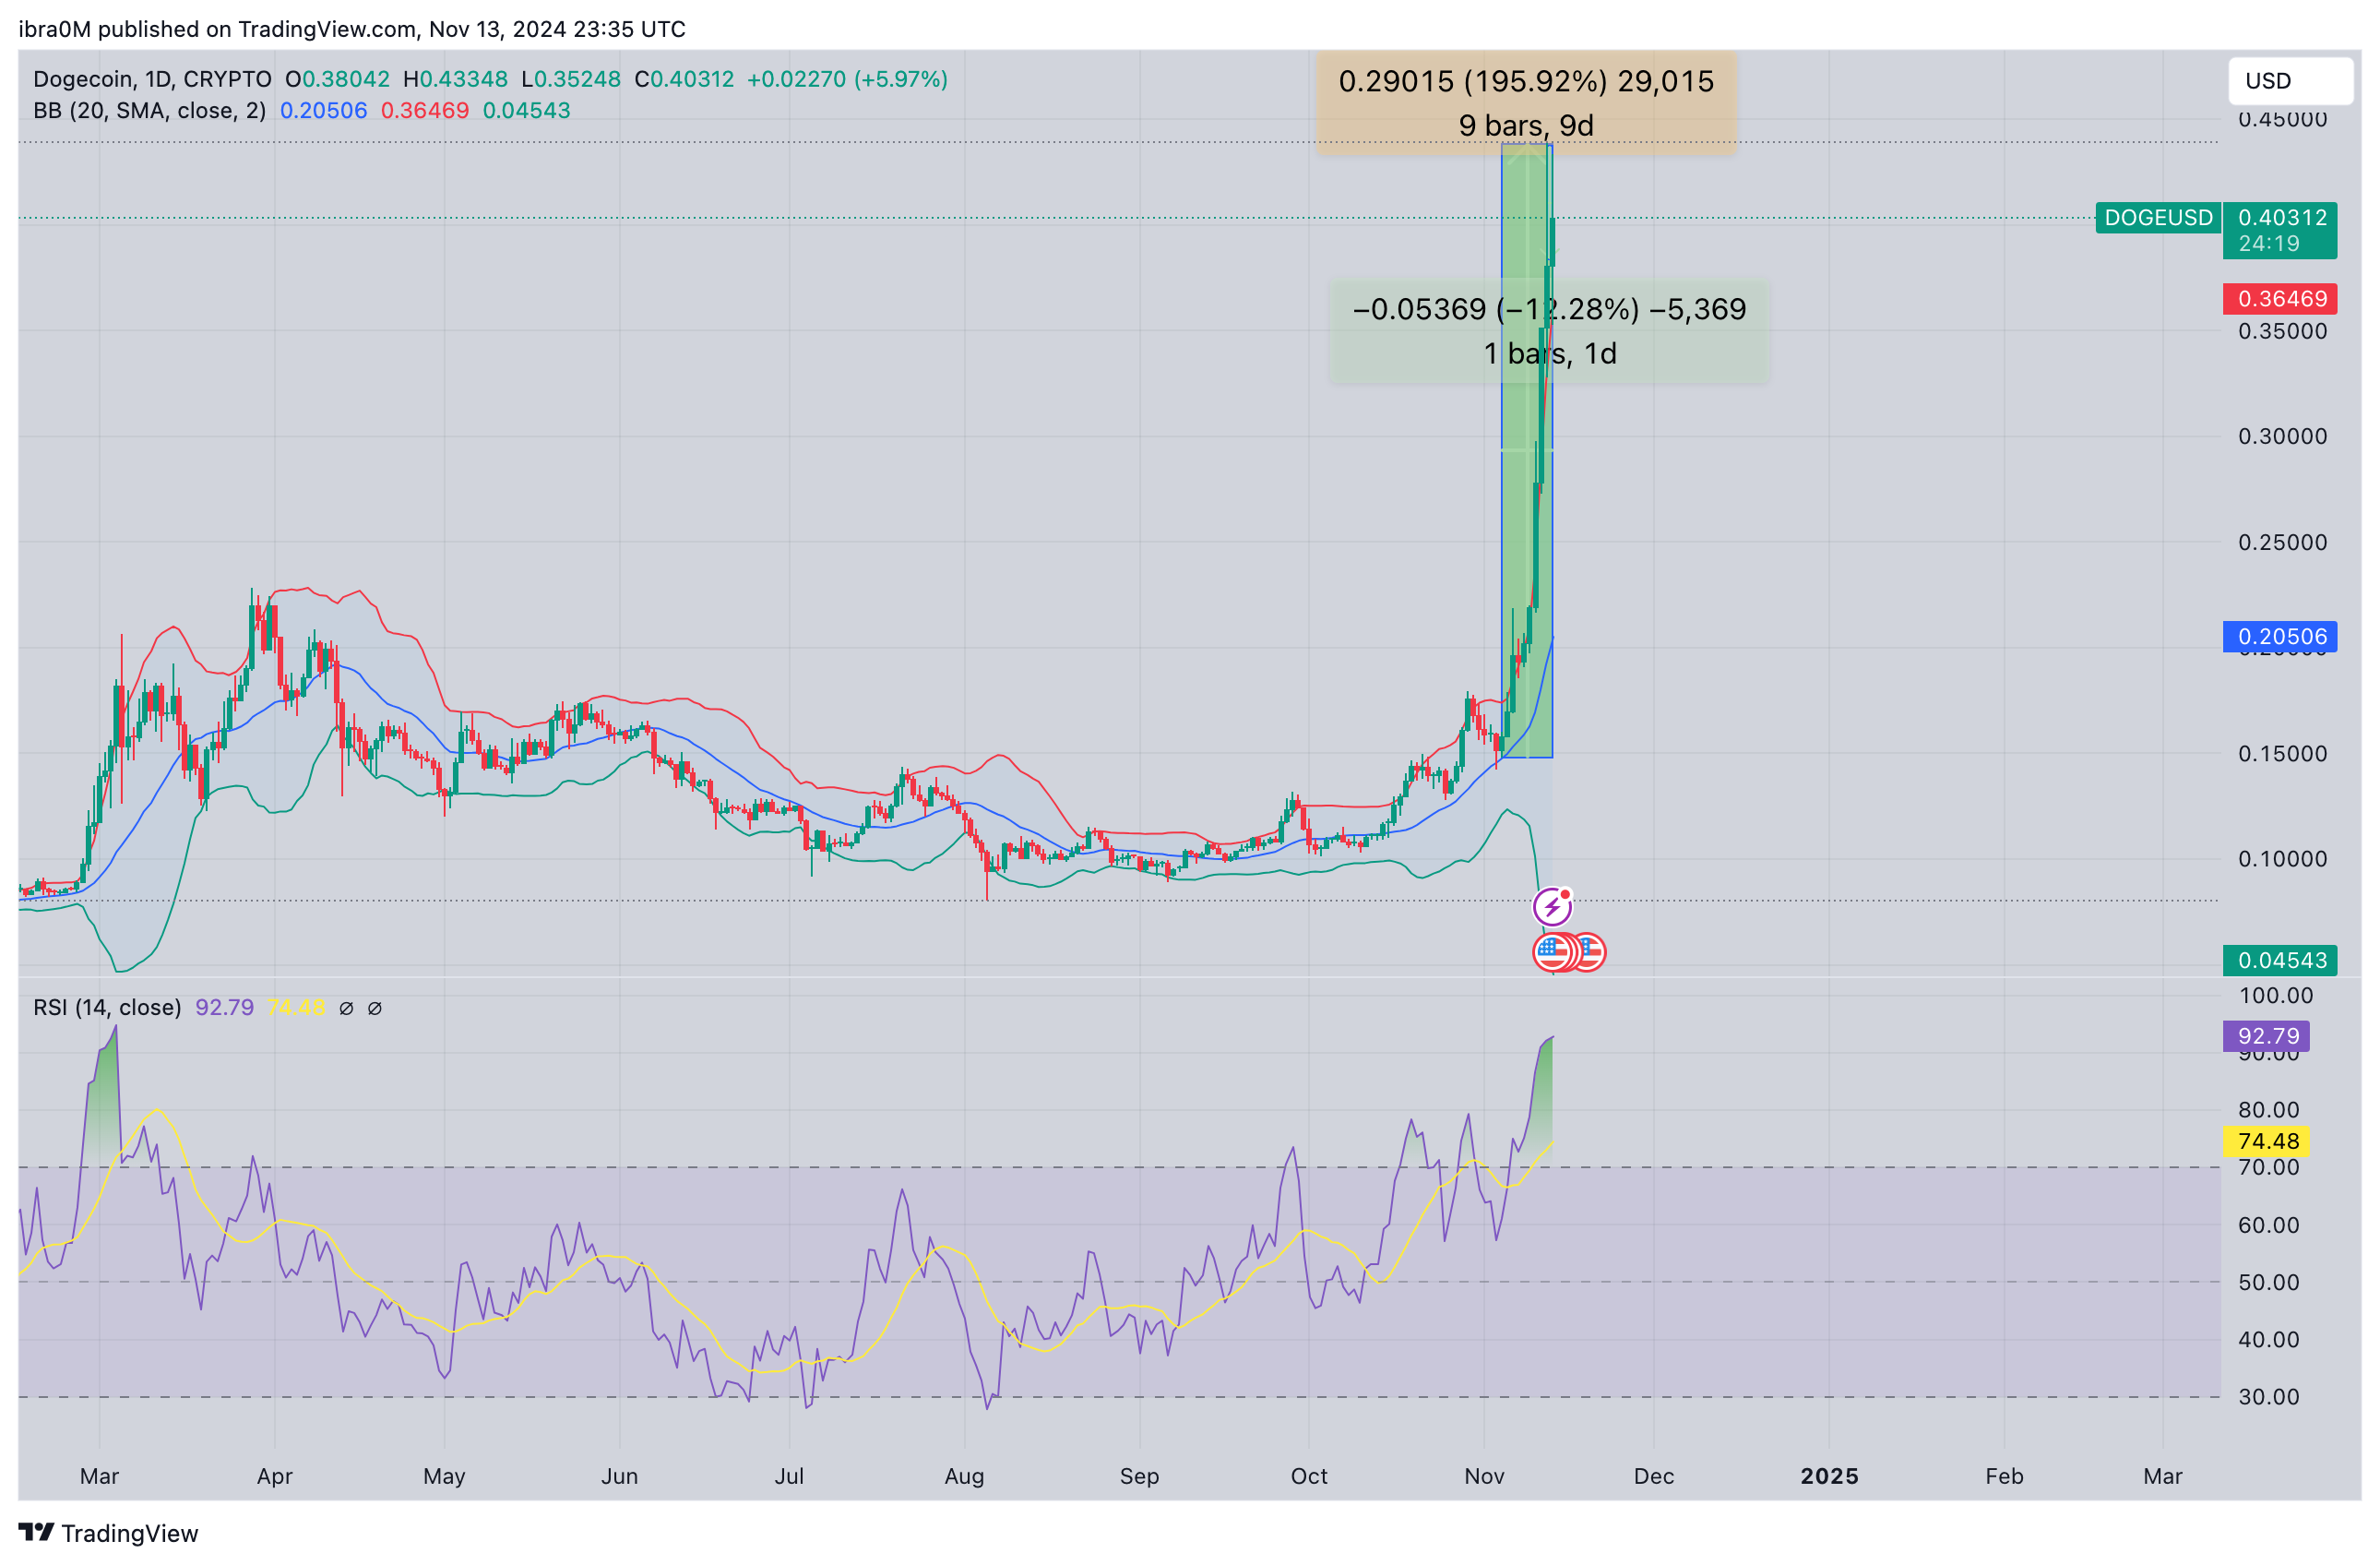
Dogecoin Price Forecast | DOGEUSD

First, the widening of the Bollinger Bands, signals heightened market volatility, which could trigger major price fluctuations in the near term.

A close below the $0.30 level could potentially trigger a negative swing in market sentiment, putting DOGE at risk of a major correction phase.

Furthermore, the RSI is firmly in the overbought zone at 92.79, suggesting that the recent rally may have reached a saturation point. 

Looking ahead, $0.30 remains a critical support level. But if bears manage to breach that key support buy-wall, DOGE could dip further toward the mid-Bollinger Band around $0.20506. 
Conversely, if the bulls regain control, the price could attempt to retest the $0.45 resistance. 
 

Disclaimer: For information purposes only. Past performance is not indicative of future results.
placeholder
Ethereum Price Slips Lower — $3,000 Looms as the Key BattlegroundEthereum is attempting to recover from a $3,026 low but remains below $3,200 and the 100-hour SMA, with a bearish trend line near $3,175 capping rebounds as bulls need a clean break above $3,200 to target $3,250–$3,400, while a drop below $3,050 risks a retest of $3,000 and $2,940.
Author  Mitrade
Dec 15, Mon
Ethereum is attempting to recover from a $3,026 low but remains below $3,200 and the 100-hour SMA, with a bearish trend line near $3,175 capping rebounds as bulls need a clean break above $3,200 to target $3,250–$3,400, while a drop below $3,050 risks a retest of $3,000 and $2,940.
placeholder
Bitcoin Slides 5% as Sellers Lean In — Can BTC Reclaim $88,000?Bitcoin has dropped back below $88,000 after rolling over from $90,500, with price still trading under the 100-hour Simple Moving Average. The sell-off found a floor at $85,151, and BTC is now consolidating near that base, but rebounds are facing pressure from a bearish trend line around $89,000. Bulls need to retake $88,000–$89,000 to ease downside risk; failure to do so keeps $85,500–$85,000 and then $83,500 in play, with $80,000 as the deeper “line in the sand.” Bitcoin (BTC) is back in damage-control mode after a sharp pullback wiped out recent gains. The price failed to reclaim the $90,000–$90,500 band, rolled over, and slid through $88,500 before briefly dipping under $87,000. Buyers did show up around $85,000, but the rebound so far looks more like stabilization than a clear trend reversal. Bitcoin dips hard, finds a bid near $85,000(h3) BTC’s latest move lower began when it couldn’t build follow-through above $90,000 and $90,500. Once that upside stalled, sellers took control and pushed price down through $88,500. The slide accelerated enough to spike below $87,000, but the market didn’t free-fall. Bulls defended the $85,000 zone, printing a low at $85,151. Since then, Bitcoin has been consolidating below the 23.6% Fibonacci retracement of the drop from the $93,560 swing high to the $85,151 low — a clue that the bounce is still shallow and that sellers haven’t fully backed off yet. Structurally, BTC is still on the back foot: It’s trading below $88,000, and It remains below the 100-hour Simple Moving Average, keeping short-term trend pressure pointed downward. Resistance is layered, and $89,000 is the problem area(h3) If bulls try to turn this into a recovery, they’ll have to climb through multiple ceilings in quick succession. First, BTC faces resistance around $87,150, followed by a more meaningful barrier near $87,500. From there, the market’s attention snaps back to $88,000 — the level BTC just lost and now needs to reclaim. A close back above $88,000 would improve the tone, but it doesn’t solve the bigger issue: there’s a bearish trend line on the hourly BTC/USD chart (Kraken feed) with resistance near $89,000, which also lines up with the next technical hurdle. If BTC can push through $89,000 and hold, the rebound could extend toward $90,000, with follow-through targets at $91,000 and $91,500. But until price clears that $88,000–$89,000 zone, rallies are at risk of being sold rather than chased. If BTC fails to reclaim resistance, the downside path is clear(h3) The near-term bear case is simple: if Bitcoin can’t climb back above the $87,000 area and keep traction, sellers may attempt another leg lower. Support levels line up like this: Immediate support: $85,500 First major support: $85,000 Next support: $83,500 Then $82,500 in the near term Below that, the major “don’t break this” level is still $80,000. If BTC slips under $80,000, the risk of acceleration to the downside increases significantly — not because it’s magic, but because it’s the kind of psychological and structural level that tends to trigger forced de-risking. Indicators: momentum still leans bearish(h3) The intraday indicators aren’t offering much comfort yet: Hourly MACD is losing pace in the bearish zone. Hourly RSI remains below 50, suggesting sellers still have the upper hand on short timeframes. So while the $85,000 defense held for now, the market hasn’t flipped bullish — it’s just stopped bleeding.
Author  Mitrade
Dec 16, Tue
Bitcoin has dropped back below $88,000 after rolling over from $90,500, with price still trading under the 100-hour Simple Moving Average. The sell-off found a floor at $85,151, and BTC is now consolidating near that base, but rebounds are facing pressure from a bearish trend line around $89,000. Bulls need to retake $88,000–$89,000 to ease downside risk; failure to do so keeps $85,500–$85,000 and then $83,500 in play, with $80,000 as the deeper “line in the sand.” Bitcoin (BTC) is back in damage-control mode after a sharp pullback wiped out recent gains. The price failed to reclaim the $90,000–$90,500 band, rolled over, and slid through $88,500 before briefly dipping under $87,000. Buyers did show up around $85,000, but the rebound so far looks more like stabilization than a clear trend reversal. Bitcoin dips hard, finds a bid near $85,000(h3) BTC’s latest move lower began when it couldn’t build follow-through above $90,000 and $90,500. Once that upside stalled, sellers took control and pushed price down through $88,500. The slide accelerated enough to spike below $87,000, but the market didn’t free-fall. Bulls defended the $85,000 zone, printing a low at $85,151. Since then, Bitcoin has been consolidating below the 23.6% Fibonacci retracement of the drop from the $93,560 swing high to the $85,151 low — a clue that the bounce is still shallow and that sellers haven’t fully backed off yet. Structurally, BTC is still on the back foot: It’s trading below $88,000, and It remains below the 100-hour Simple Moving Average, keeping short-term trend pressure pointed downward. Resistance is layered, and $89,000 is the problem area(h3) If bulls try to turn this into a recovery, they’ll have to climb through multiple ceilings in quick succession. First, BTC faces resistance around $87,150, followed by a more meaningful barrier near $87,500. From there, the market’s attention snaps back to $88,000 — the level BTC just lost and now needs to reclaim. A close back above $88,000 would improve the tone, but it doesn’t solve the bigger issue: there’s a bearish trend line on the hourly BTC/USD chart (Kraken feed) with resistance near $89,000, which also lines up with the next technical hurdle. If BTC can push through $89,000 and hold, the rebound could extend toward $90,000, with follow-through targets at $91,000 and $91,500. But until price clears that $88,000–$89,000 zone, rallies are at risk of being sold rather than chased. If BTC fails to reclaim resistance, the downside path is clear(h3) The near-term bear case is simple: if Bitcoin can’t climb back above the $87,000 area and keep traction, sellers may attempt another leg lower. Support levels line up like this: Immediate support: $85,500 First major support: $85,000 Next support: $83,500 Then $82,500 in the near term Below that, the major “don’t break this” level is still $80,000. If BTC slips under $80,000, the risk of acceleration to the downside increases significantly — not because it’s magic, but because it’s the kind of psychological and structural level that tends to trigger forced de-risking. Indicators: momentum still leans bearish(h3) The intraday indicators aren’t offering much comfort yet: Hourly MACD is losing pace in the bearish zone. Hourly RSI remains below 50, suggesting sellers still have the upper hand on short timeframes. So while the $85,000 defense held for now, the market hasn’t flipped bullish — it’s just stopped bleeding.
placeholder
December Santa Claus Rally: New highs in sight for US and European stocks?Historical data show a rising trend of US and European stocks in December. If the momentum is strong, fund managers may rush in with a buying frenzy.
Author  Mitrade
Yesterday 02: 50
Historical data show a rising trend of US and European stocks in December. If the momentum is strong, fund managers may rush in with a buying frenzy.
placeholder
XRP’s Price Action Flashes a Warning Even as ETF Flows Stay PositiveXRP’s structure remains weak despite 18 straight positive closes in spot XRP ETFs, with analysts warning that $1.98 and other nearby resistance zones could cap rebounds unless the YO region is reclaimed, while deeper downside scenarios keep $1.53 on watch as a potential (not guaranteed) accumulation area.
Author  Mitrade
Yesterday 06: 37
XRP’s structure remains weak despite 18 straight positive closes in spot XRP ETFs, with analysts warning that $1.98 and other nearby resistance zones could cap rebounds unless the YO region is reclaimed, while deeper downside scenarios keep $1.53 on watch as a potential (not guaranteed) accumulation area.
placeholder
Gold declines on profit-taking, USD strength ahead of US CPI releaseGold price (XAU/USD) edges lower below $4,350 during the Asian trading hours on Thursday. The precious metal retreats from seven-week highs amid some profit-taking and a rebound in the US Dollar (USD).
Author  FXStreet
3 hours ago
Gold price (XAU/USD) edges lower below $4,350 during the Asian trading hours on Thursday. The precious metal retreats from seven-week highs amid some profit-taking and a rebound in the US Dollar (USD).
goTop
quote