

European stocks mixed on Monday as markets look to earnings and ECB rate call
- Europe saw mixed results in equity indexes for the new trading week.
- Energies climb, but financials stumbled.
- ECB officials drive rate cut expectations to the forefront.
European equities spread on Monday as markets compare last week’s rate hold from the European Central Bank (ECB) mixes like water and oil with early rate-cut talk from ECB policymakers to spark headlines as the new trading week gets underway.
Momentum eased in European stocks on Monday after hitting multi-year highs on Friday, leaving investors to reconsider their positioning after banks and financials saw declines despite energy sector indexes marking in slight gains.
The ECB is firmly at the top of the rate hike cycle, and the central bank’s next move is well-telegraphed as a cut, and now all that’s left is for markets to negotiate the specifics of when the ECB will trim rates.
ECB’s Centeno: Should start cutting rates sooner rather than later
Money markets are fully priced in on a first 25 basis point rate cut from the ECB by May, with rate swaps expecting 149 basis points in overall rate cuts through the end of the year.
ECB officials landed on opposite sides of how fast rate cuts should come on Monday, further muddying the waters on rate cut expectations heading into the midyear.
ECB’s Kazimir: A rate cut in June is more probable than in April
European Gross Domestic Product (GDP) figures are due on Tuesday, and investors will be looking for a rebound in Germany’s fourth quarter GDP while pan-European QoQ GDP is expected to stump in at -0.1%.
Germany’s DAX index slid 0.12% to close down nearly 20 points at €16,941.71, while London’s FTSE major equity index ended Monday nearly flat at 0.03% at £7,632.74, down 2.35 points.
France’s CAC40 gained 6.67 points to end up nearly a tenth of a percent at €7,640.81, while the pan-European STOXX600 index climbed one full point to close at €484.84, gaining 0.21%.
DAX technical outlook
Germany’s DAX saw an early decline to kick off the trading week, testing into near-term medians near €16,850.00 at the 50-hour Simple Moving Average (SMA).
A mid-day rebound kept the index trimmed into the day’s opening bids and Monday saw limited change to open the new trading week.
Despite Monday’s hesitancy, the DAX is well-bid into the top end, trading into all-time highs near the €17,000.00 and the index is set to close in the green for the third straight month.
DAX Hourly Chart
DAX Daily Chart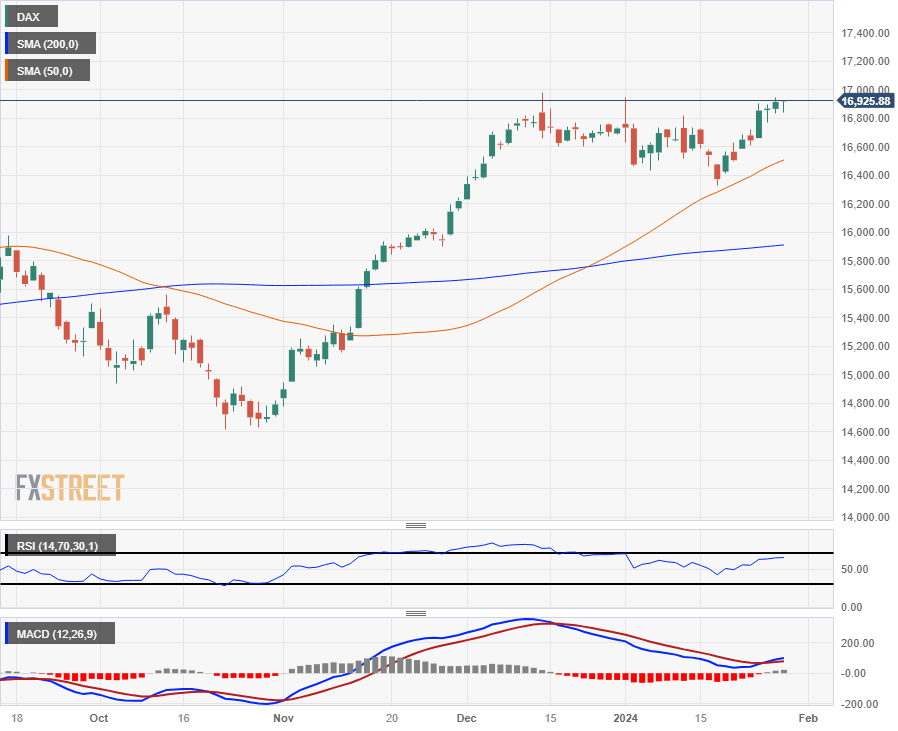
Recommended Articles


