

European equities extend recent gains on Monday, DAX inches back towards €16,800
- European indexes broadly climbed to kick off the new trading week.
- Risk appetite is extending bids in echoes of last week’s bidding frenzy.
- FOMO-inflicted investors are piling into stocks ahead of data risks.
European equity indexes gained ground across the board on Monday, reaching for further gains as traders dogpile into indexes ahead of a mid-week plethora of European data events on the calendar, with euro area Purchasing Managers’ Indexes (PMI) and a rate call from the European Central Bank (ECB) on the offering.
European indexes wrapped up last week largely in the green despite a steep pullback a week ago, and EU equities are extending late last week’s risk appetite into further gains with US Treasury yields easing back. The 20-year US Treasury yield fell back below 4.4% once again on Monday, hitting a low of 4.366% and sending equity investors back into stocks.
This week sees a wave of European data slated for the mid-week hump, with euro area PMIs broadly forecast to show slight but determined upticks, and markets will be pivoting to focus on the ECB’s latest rate call on Thursday.
The ECB is all but guaranteed to continue holding rates until at least the summer months as premature market hopes of first-quarter rate cuts get dashed by still-high inflation figures and wobbly economic figures throughout the European continent.
ECB policymakers have been working overtime trying to talk down market expectations of fast and deep rate cuts from the ECB in 2024, spurring ECB President Christine Lagarde last week to warn that heavy-handed market bets on fast and soon rate cuts are muddling the outlook, making the ECB’s job harder and risking further damage to the European economy.
The pan-European STOXX600 major equity index climbed 3.62 points on Monday to close 0.77% higher at €472.86, while France’s CAC gained 0.56% to close at €7,413.25, up 41.61 points.
London’s FTSE index also gained 25.78 points, climbing 0.35% to end Monday at £7,487.71 to gain 35.87 points.
The Germam DAX also gained 0.77% gain on Monday, gaining 128.33 points to close at €16,683.36.
DAX Technical Outlook
The German Dax equity index extended higher on Monday, climbing further out of recent declines. The German index fell peak-to-trough nearly 4% from December’s peak near €16,984.00, and bidders will be looking to wrestle back control of the DAX. The major index continue to find technical support from the 50-day Simple Moving Average (SMA) near €16,400.00, and long-term technical support is pricing in a floor just above €15,800.
DAX Hourly Chart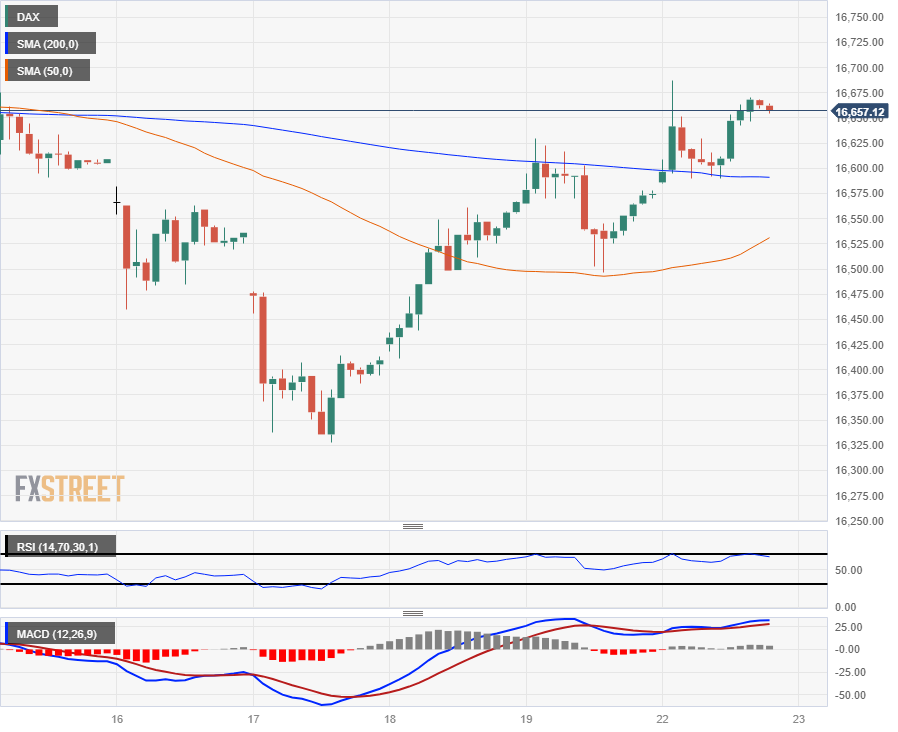
DAX Daily Chart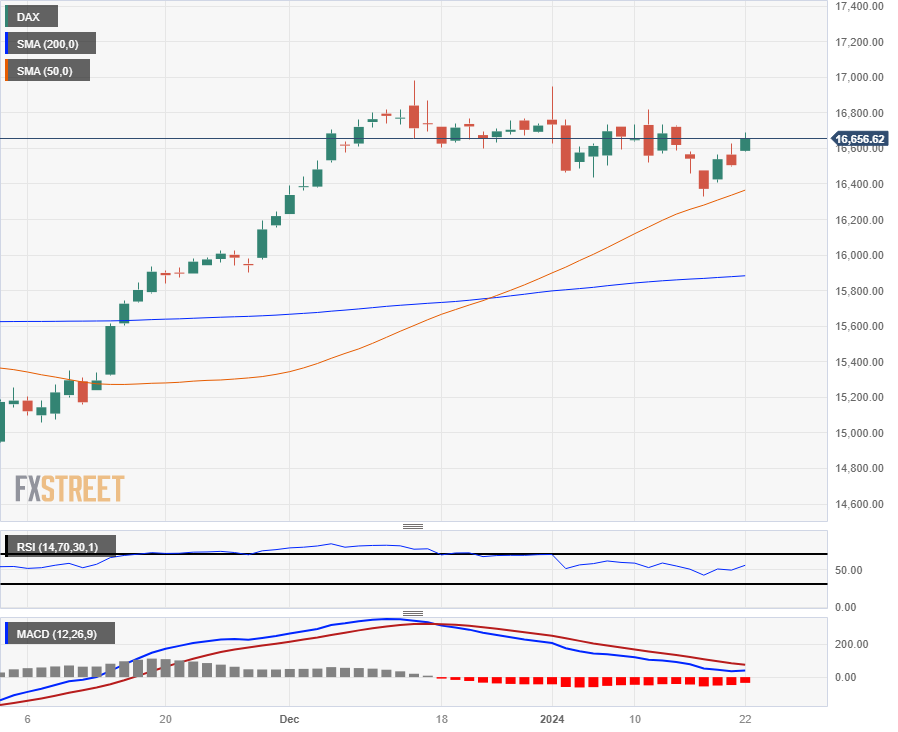
Recommended Articles


