USD/THB remains resilient and finds additional gains following FOMC minutes

Source Fxstreet
  • The USD/THB pair is showing signs of resilience on Wednesday, ticking up by 0.28%.
  • FOMC’s minutes from May’s meeting showed that members are uncertain on how long it will take inflation to come back to 2%.
  • The odds of the easing starting in September slightly declined.

The USD/THB pair trades with modest gains on Wednesday as the Greenback is resilient despite last week's weak inflation data, underpinned by the hawkish tone of Fed officials. The Federal Open Market Committee (FOMC) showed no surprises and showed that the bank is confident that the job of bringing inflation down to 2% will eventually be achieved, but that they are uncertain on how long it would take them.

On Thursday, the US will release mid-tier data including weekly Jobless Claims figures and May’s S&P PMIs. On Friday, Durable Goods data from April are due. This set of data might provide further insights on the health of the US economy which might trigger movements on the pair and the assessment of the Fed officials regarding the timing of the easing. As for now, according to the CME FedWatch tool, the odds of a cut in June and July remain low while those chances for the September meeting declined to 40%.

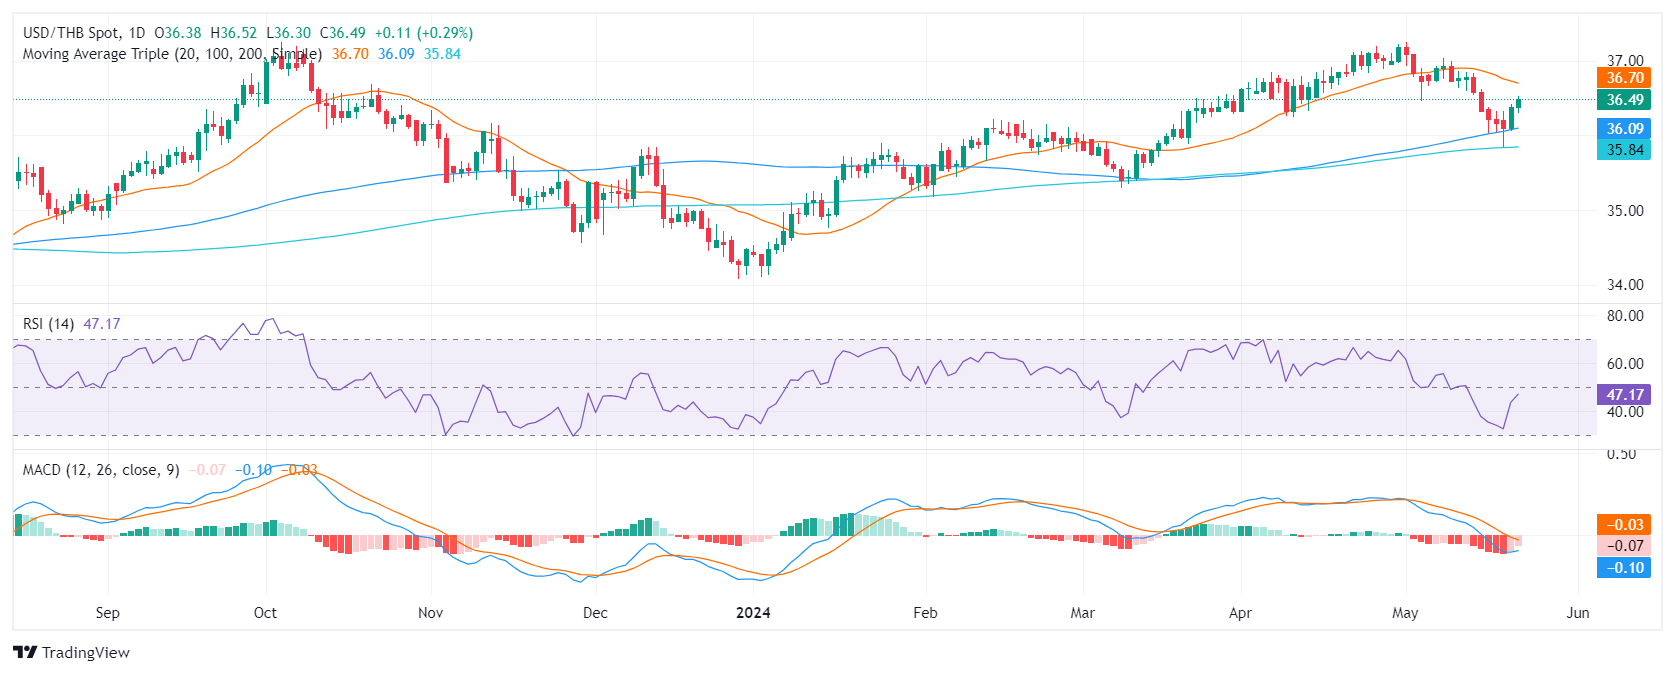
USD/THB technical analysis

On the daily chart, the Relative Strength Index (RSI) is in a neutral position, registering at 49 on Tuesday. This falls within negative territory after indicating oversold conditions in the last sessions, reflecting seller dominance. A slight recovery from the oversold region hints at a potential market revival despite remaining within the negative range.

Concurrently, the trend shown by the Moving Average Convergence Divergence (MACD) histogram supports this potential revival as it exhibits a decreasing number of negative bars, indicating a descending pattern within the red spectrum of the histogram.

USD/THB daily chart

Disclaimer: For information purposes only. Past performance is not indicative of future results.
placeholder
ECB Policy Outlook for 2026: What It Could Mean for the Euro’s Next MoveWith the ECB likely holding rates steady at 2.15% and the Fed potentially extending cuts into 2026, EUR/USD may test 1.20 if Eurozone growth proves resilient, but weaker growth and an ECB pivot could pull the pair back toward 1.13 and potentially 1.10.
Author  Mitrade
Dec 26, 2025
With the ECB likely holding rates steady at 2.15% and the Fed potentially extending cuts into 2026, EUR/USD may test 1.20 if Eurozone growth proves resilient, but weaker growth and an ECB pivot could pull the pair back toward 1.13 and potentially 1.10.
placeholder
My Top 5 Stock Market Predictions for 2026Five 2026 market predictions written in a native, news-style voice: AI’s winners and losers, broader sector leadership, dividend demand, valuation cooling as the Shiller CAPE sits at 39 (Dec. 31, 2025), and quantum-computing bursts—while keeping all original facts and numbers unchanged.
Author  Mitrade
Jan 06, Tue
Five 2026 market predictions written in a native, news-style voice: AI’s winners and losers, broader sector leadership, dividend demand, valuation cooling as the Shiller CAPE sits at 39 (Dec. 31, 2025), and quantum-computing bursts—while keeping all original facts and numbers unchanged.
placeholder
Financial Markets 2026: Volatility Catalysts in Gold, Silver, Oil, and Blue-Chip Stocks—A CFD Trader's OutlookGet a comprehensive financial market 2026 outlook exploring key economic drivers, volatility catalysts in gold, oil and stocks, and what the evolving economic outlook means for cfd trading strategies and risk management on global markets.
Author  Rachel Weiss
21 hours ago
Get a comprehensive financial market 2026 outlook exploring key economic drivers, volatility catalysts in gold, oil and stocks, and what the evolving economic outlook means for cfd trading strategies and risk management on global markets.
placeholder
Bitcoin Weekly Forecast: Is the month-long rally over?Bitcoin (BTC) edges slightly lower so far this week, trading at $80,800 on Friday after being rejected around the key overhead supply zone. Institutional investors also show cautious signs, with BTC spot Exchange Traded Funds (ETFs) recording an outflow of over $709 million through Thursday.
Author  Bitcoinist
21 hours ago
Bitcoin (BTC) edges slightly lower so far this week, trading at $80,800 on Friday after being rejected around the key overhead supply zone. Institutional investors also show cautious signs, with BTC spot Exchange Traded Funds (ETFs) recording an outflow of over $709 million through Thursday.
placeholder
Financial Markets 2026: Volatility Catalysts in Gold, Silver, Oil, and Blue-Chip Stocks—A CFD Trader's OutlookGet a comprehensive financial market 2026 outlook exploring key economic drivers, volatility catalysts in gold, oil and stocks, and what the evolving economic outlook means for cfd trading strategies and risk management on global markets.
Author  Rachel Weiss
21 hours ago
Get a comprehensive financial market 2026 outlook exploring key economic drivers, volatility catalysts in gold, oil and stocks, and what the evolving economic outlook means for cfd trading strategies and risk management on global markets.
goTop
quote