

Cardano Lace Wallet integrates Bitcoin, boosting cross-chain capabilities
- Charles Hoskinson announced on Monday that Bitcoin integrates into the Lace Wallet, expanding Cardano’s ecosystem and cross-chain capabilities.
- This integration enables users to manage BTC alongside Cardano assets, providing support for multichain functionality.
- The news failed to move Cardano’s price significantly, but suggests a positive outlook for ADA.
Cardano (ADA) co-founder Charles Hoskinson announced Monday that Bitcoin (BTC) is integrated into the Lace Wallet, expanding Cardano’s ecosystem and cross-chain capabilities. This integration enables users to manage BTC alongside Cardano assets, providing support for multichain functionality. The news failed to move Cardano’s price significantly, with ADA trading in a narrow range near $0.70 at the time of writing on Tuesday, but it suggests a positive outlook for the token.
Cardano’s co-founder welcomes Bitcoin
On Monday, Charles Hoskinson announced on his X post that Bitcoin is integrated into the Lace Wallet, a non-custodial wallet platform developed by Input Output Global (IOG), one of the key organizations behind the Cardano blockchain. Lace allows users to send, receive, and stake Cardano’s native cryptocurrency, ADA, and manage other digital assets on the network.
“With this release, Lace becomes even more accessible and versatile, introducing Firefox support, the beta rollout of Bitcoin, and several performance improvements under the hood,” says Lace in its blog post.
This integration enables users to manage BTC alongside Cardano assets, providing support for multichain functionality. However, this news did not significantly impact Cardano’s price on Monday; nonetheless, it suggests a positive outlook for the long term as it expands Cardano’s ecosystem, enhances its cross-chain capabilities, and boosts wider adoption.
Cardano's technical outlook suggests a rally if it closes above $0.74
Cardano price is facing resistance around its 200-day Exponential Moving Average (EMA) at $0.71 since last week and declined to find support at the 61.8% Fibonacci retracement (drawn from the August 5 low of $0.27 to the December 3 high of $1.32) at $0.66 on Monday. At the time of writing on Tuesday, ADA hovers around the 200-day EMA at $0.71.
If ADA breaks above the 200-day EMA and closes above its weekly resistance level at $0.74, it could extend the rally to retest its next daily resistance at $0.80.
The Relative Strength Index (RSI) stands at 59, indicating bullish momentum, as it is positioned above its neutral level of 50. The Moving Average Convergence Divergence (MACD) also exhibited a bullish crossover last week, providing a buy signal and indicating a potential continuation of the upward trend.
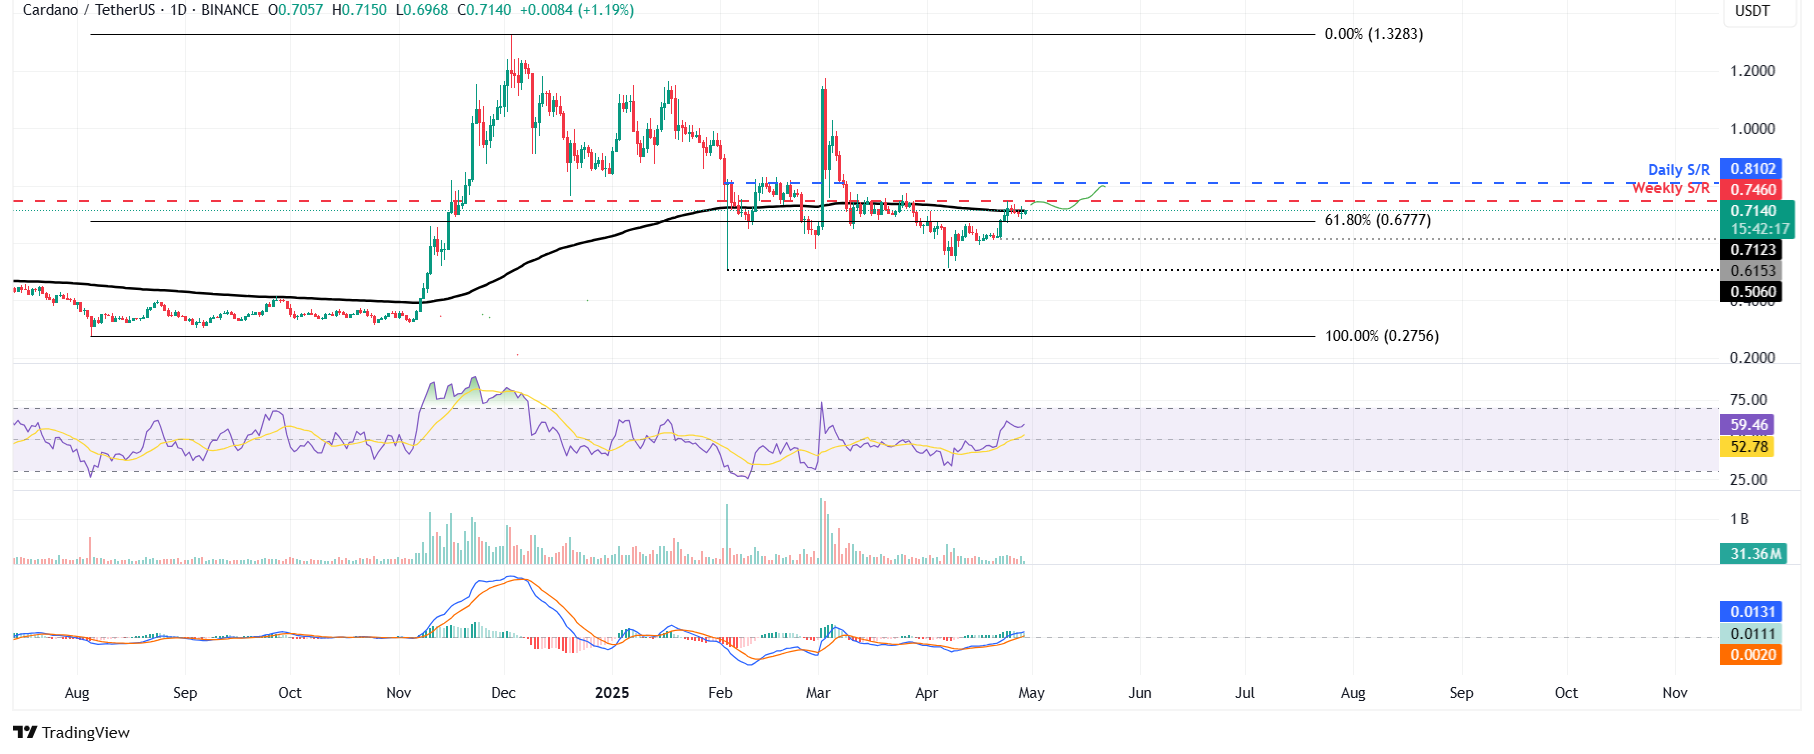
ADA/USDT daily chart
However, if ADA’s daily candlestick closes below the 61.8% Fibonacci level at $0.66, it could extend the decline to retest its April 22 low of $0.61.
Recommended Articles


