

Monero Price Forecast: XMR soars over 19% amid rising demand for privacy coins

Source Fxstreet
  • Monero price extends its gains on Monday after rallying 9.33% the previous week.
  • On-chain metrics paint a bullish picture, with open interest reaching its highest level since December 20.
  • The technical outlook suggests a continuation of the rally with a target of $345.

Monero (XMR) price is extending its gains by 19% at the time of writing on Monday, following a 9.33% rally the previous week. On-chain metrics support this price surge, with XMR’s open interest reaching its highest level since December 20. The technical outlook suggests a bullish breakout and continuation of the rally, with a target of $345.

Monero could surge as it breaks above the ascending triangle formation

Monero price breaks above the ascending triangle formation on the daily chart, rallying over 19% at the time of writing on Monday. This pattern was created by drawing two trendlines from mid-November, connecting swing points on the daily chart between multiple higher lows and multiple equal highs.

This technical pattern breakout favors the bulls, and the target is generally obtained by measuring the distance between the first daily high and the first daily low to the breakout point. 

If the breakout level is retested and support is found around the daily level of $241.95, XMR could rally toward its technical target of $345.23. However, traders are suggested to book profits around the $300 level.

The Relative Strength Index (RSI) momentum indicator on the daily chart reads at 83, above its overbought level of 70, suggesting the ongoing rally could face cooling pressures. However, the bullish momentum remains strong.
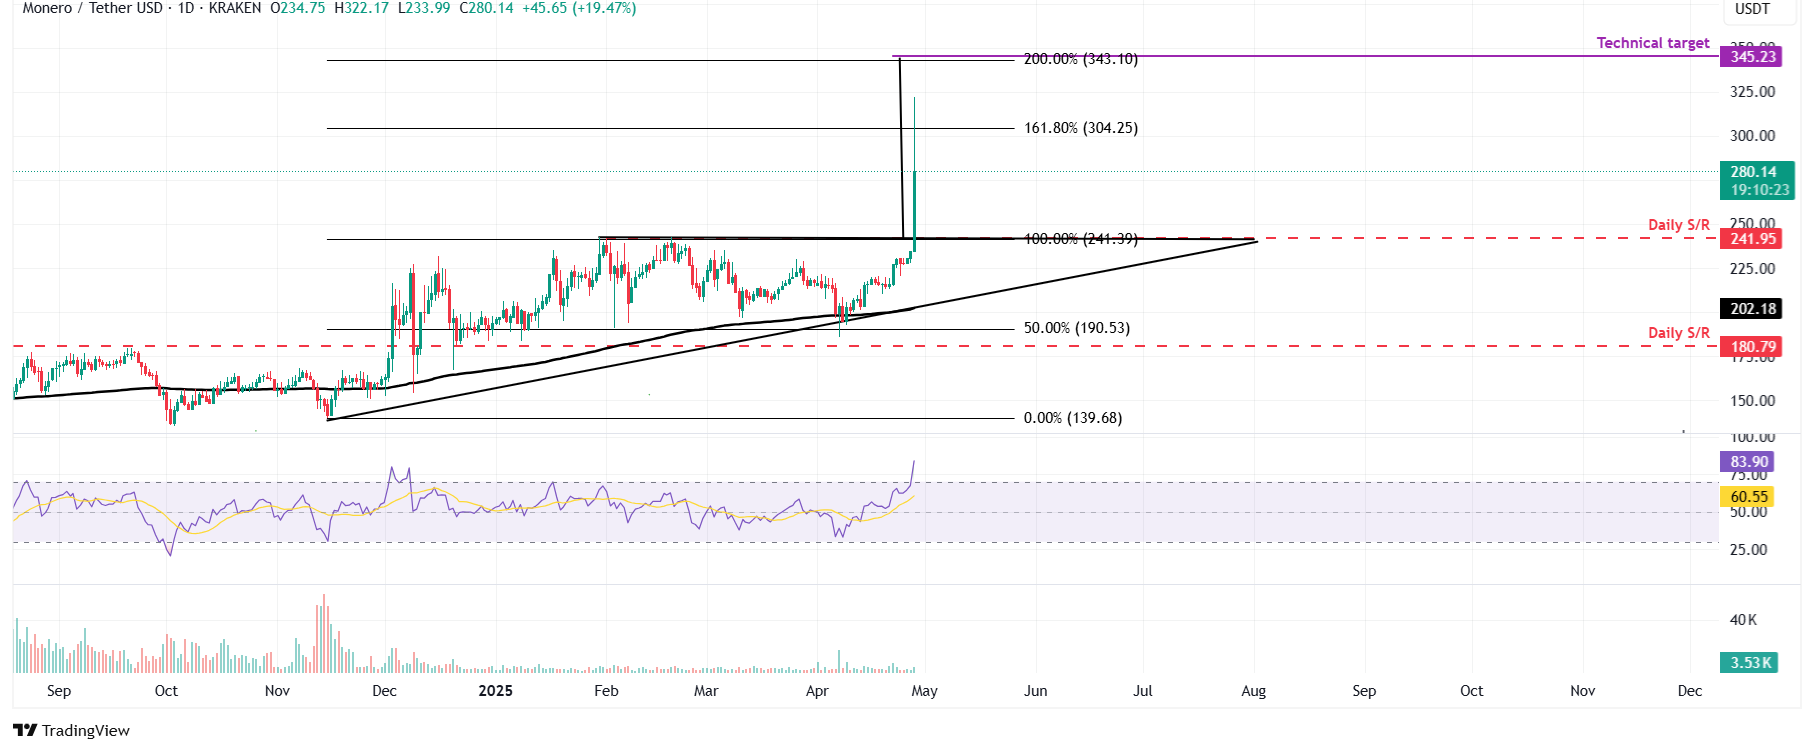
XMR/USDT daily chart

XMR/USDT daily chart

Monero’s open interest reaches its highest year-to-date 

Monero’s Open Interest (OI) further supports the bullish outlook. Coinglass’ data shows that the futures’ OI in XMR at exchanges rose from $20.13 million on Friday to $30.38 million on Monday, reaching a new year-to-date (YTD) high. An increasing OI represents new or additional money entering the market and new buying, which suggests a rally ahead in the Monero price.
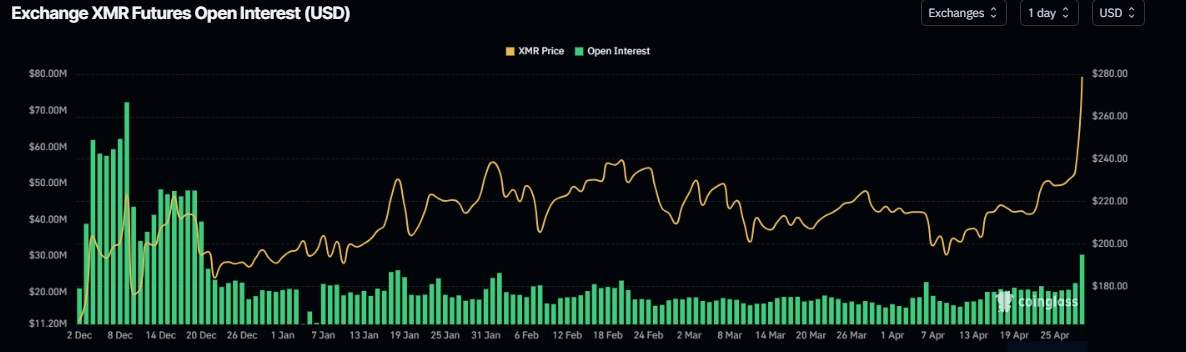
XMR open interest chart. Source: Coinglass

XMR open interest chart. Source: Coinglass

Disclaimer: For information purposes only. Past performance is not indicative of future results.
placeholder
My Top 5 Stock Market Predictions for 2026Five 2026 market predictions written in a native, news-style voice: AI’s winners and losers, broader sector leadership, dividend demand, valuation cooling as the Shiller CAPE sits at 39 (Dec. 31, 2025), and quantum-computing bursts—while keeping all original facts and numbers unchanged.
Author  Mitrade
Jan 06, Tue
Five 2026 market predictions written in a native, news-style voice: AI’s winners and losers, broader sector leadership, dividend demand, valuation cooling as the Shiller CAPE sits at 39 (Dec. 31, 2025), and quantum-computing bursts—while keeping all original facts and numbers unchanged.
placeholder
Financial Markets 2026: Volatility Catalysts in Gold, Silver, Oil, and Blue-Chip Stocks—A CFD Trader's OutlookGet a comprehensive financial market 2026 outlook exploring key economic drivers, volatility catalysts in gold, oil and stocks, and what the evolving economic outlook means for cfd trading strategies and risk management on global markets.
Author  Rachel Weiss
May 15, Fri
Get a comprehensive financial market 2026 outlook exploring key economic drivers, volatility catalysts in gold, oil and stocks, and what the evolving economic outlook means for cfd trading strategies and risk management on global markets.
placeholder
Gold Price Forecast: Can Gold Keep Rising After Reclaiming $4,400 as Markets Await Upcoming CPI Data?During Wednesday's Asian trading session, spot gold (XAUUSD) extended its rebound, reclaiming $4,400/oz. As of 11:08 Beijing time on August 12, spot gold was trading at $4,414.705/oz, up
Author  TradingKey
Aug 12, Wed
During Wednesday's Asian trading session, spot gold (XAUUSD) extended its rebound, reclaiming $4,400/oz. As of 11:08 Beijing time on August 12, spot gold was trading at $4,414.705/oz, up
placeholder
WTI declines below $82.50 as oil inventories rise far more than expectedWest Texas Intermediate (WTI), the US crude oil benchmark, is trading around $82.45 during the early Asian trading hours on Thursday. WTI declines on a larger-than-expected build in US crude oil inventories. Traders will closely monitor the developments surrounding US-Iran talks for fresh impetus. 
Author  FXStreet
Aug 13, Thu
West Texas Intermediate (WTI), the US crude oil benchmark, is trading around $82.45 during the early Asian trading hours on Thursday. WTI declines on a larger-than-expected build in US crude oil inventories. Traders will closely monitor the developments surrounding US-Iran talks for fresh impetus. 
placeholder
WTI remains below $80.50 as traders monitor diplomatic efforts to reopen HormuzWest Texas Intermediate (WTI) oil price remains subdued for the third successive day, trading around $80.30 per barrel during the Asian hours on Friday. Crude oil prices edge lower as investors adopt a wait-and-see approach, closely monitoring diplomatic attempts to reopen the Strait of Hormuz.
Author  FXStreet
Yesterday 01: 20
West Texas Intermediate (WTI) oil price remains subdued for the third successive day, trading around $80.30 per barrel during the Asian hours on Friday. Crude oil prices edge lower as investors adopt a wait-and-see approach, closely monitoring diplomatic attempts to reopen the Strait of Hormuz.
goTop
quote