

Silver Price Forecast: XAG/USD bulls have the upper hand while above $33.00 hurdle breakpoint
- Silver retreats after touching a fresh multi-month high during the Asian session on Thursday.
- The technical setup favors bulls and supports prospects for the emergence of some dip-buyers.
- A convincing break below the $32.00 mark is needed to negate the near-term positive outlook.
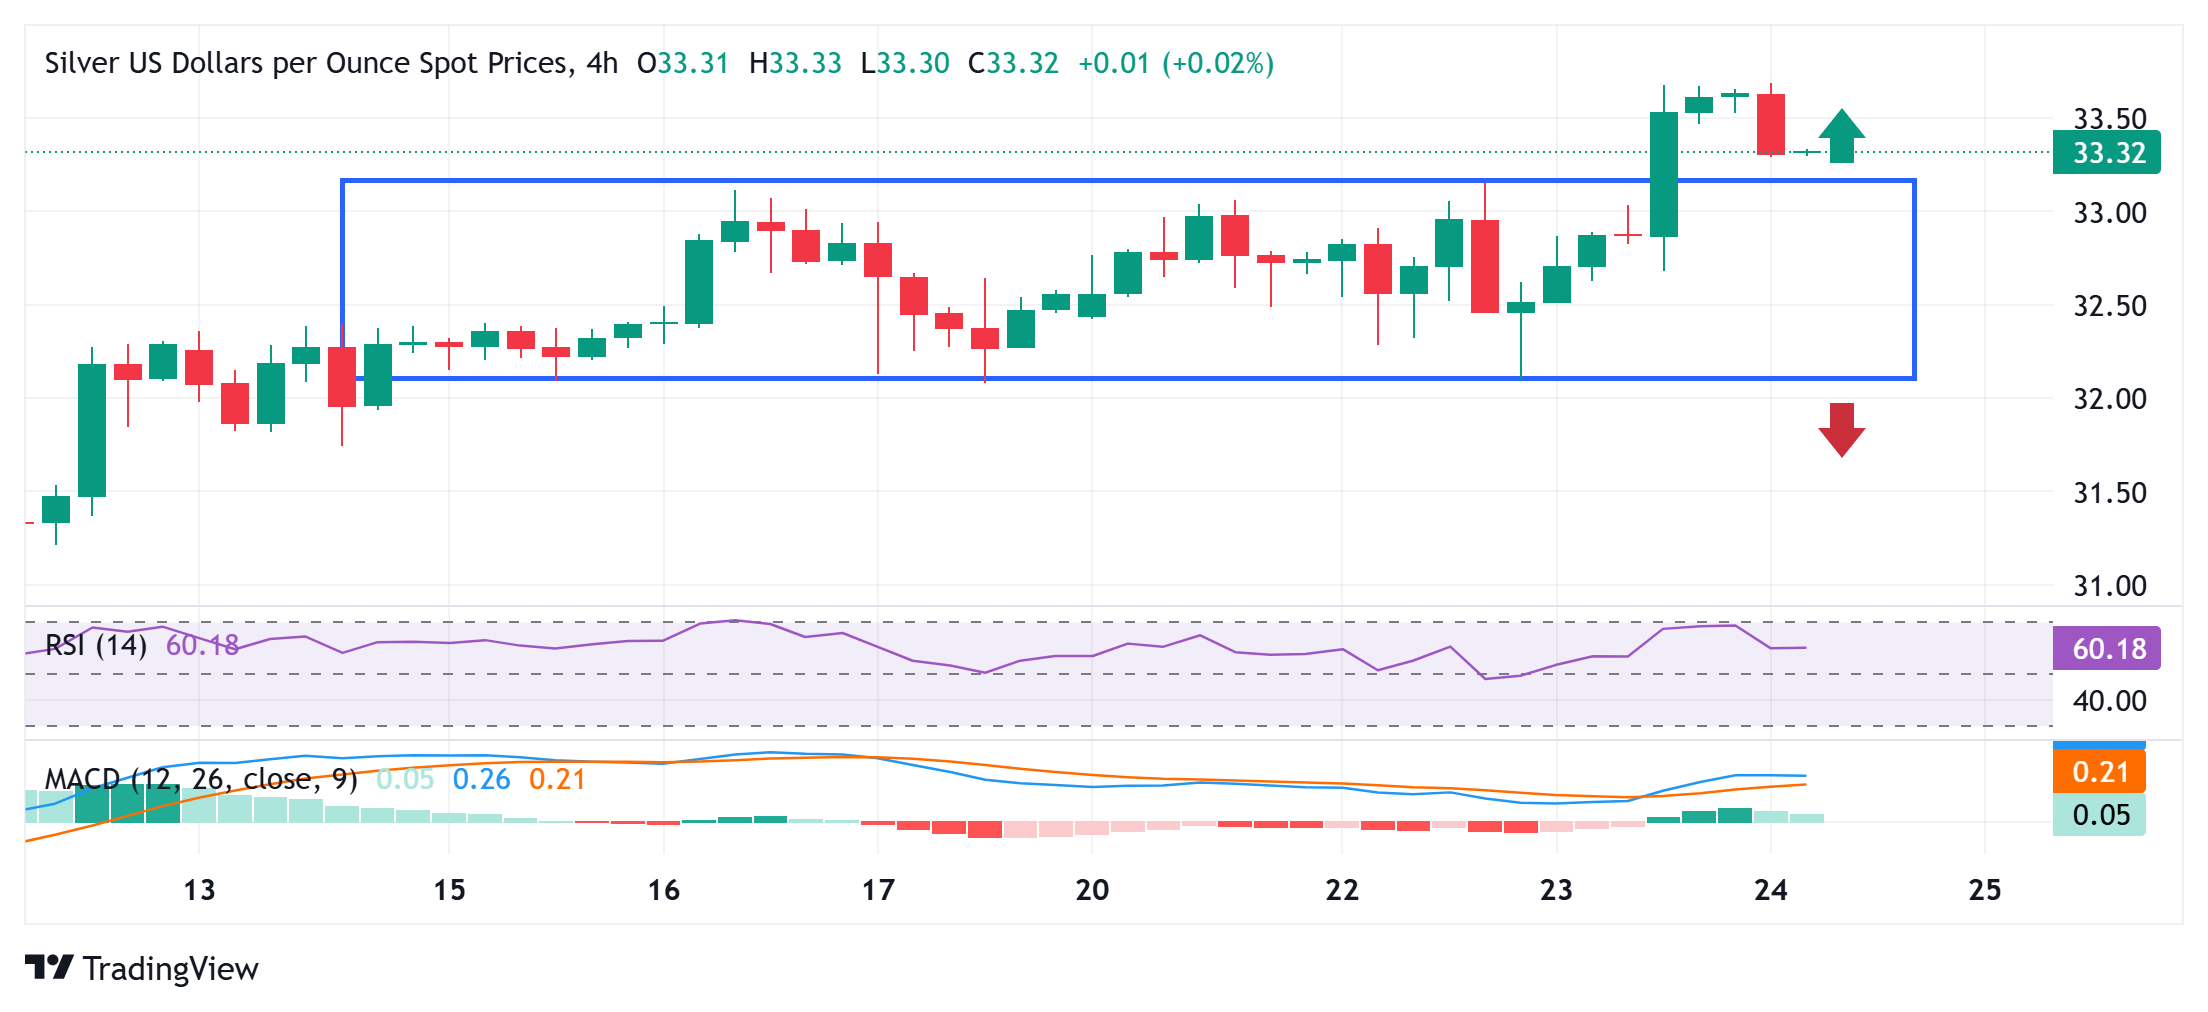
Silver (XAG/USD) attracts some sellers after hitting a nearly three-week top near the $33.70 region during the Asian session on Thursday and erodes a part of the previous day's strong move up. The white metal currently trades around the $33.35-$33.30 area, down 0.75% for the day, though the technical setup supports prospects for the emergence of dip-buyers at lower levels.
The overnight breakout through a short-term trading range held over the past week or so, along with the fact that oscillators on the daily chart have just started gaining positive traction, validates the near-term positive outlook for the XAG/USD. Hence, any further decline is more likely to get bought into the $33.00 round figure mark, which should now act as a key pivotal point.
A convincing break below the said handle might prompt some technical selling and drag the XAG/USD further toward the $32.40 support en route to the $32.10-$32.00 area. Some follow-through selling will suggest that the recent recovery from the $28.00 mark, or the year-to-date low touched earlier this month, has run out of steam and pave the way for deeper losses.
On the flip side, momentum beyond the Asian session high, around the $33.70 region, should allow the XAG/USD to reclaim the $34.00 mark. The subsequent move higher could lift the commodity towards the $34.30 intermediate hurdle en route to the $34.55-$34.60 area or the highest level since October 2024 touched last month and the $35.00 psychological mark.
Silver 4-hour chart
Silver FAQs
Silver is a precious metal highly traded among investors. It has been historically used as a store of value and a medium of exchange. Although less popular than Gold, traders may turn to Silver to diversify their investment portfolio, for its intrinsic value or as a potential hedge during high-inflation periods. Investors can buy physical Silver, in coins or in bars, or trade it through vehicles such as Exchange Traded Funds, which track its price on international markets.
Silver prices can move due to a wide range of factors. Geopolitical instability or fears of a deep recession can make Silver price escalate due to its safe-haven status, although to a lesser extent than Gold's. As a yieldless asset, Silver tends to rise with lower interest rates. Its moves also depend on how the US Dollar (USD) behaves as the asset is priced in dollars (XAG/USD). A strong Dollar tends to keep the price of Silver at bay, whereas a weaker Dollar is likely to propel prices up. Other factors such as investment demand, mining supply – Silver is much more abundant than Gold – and recycling rates can also affect prices.
Silver is widely used in industry, particularly in sectors such as electronics or solar energy, as it has one of the highest electric conductivity of all metals – more than Copper and Gold. A surge in demand can increase prices, while a decline tends to lower them. Dynamics in the US, Chinese and Indian economies can also contribute to price swings: for the US and particularly China, their big industrial sectors use Silver in various processes; in India, consumers’ demand for the precious metal for jewellery also plays a key role in setting prices.
Silver prices tend to follow Gold's moves. When Gold prices rise, Silver typically follows suit, as their status as safe-haven assets is similar. The Gold/Silver ratio, which shows the number of ounces of Silver needed to equal the value of one ounce of Gold, may help to determine the relative valuation between both metals. Some investors may consider a high ratio as an indicator that Silver is undervalued, or Gold is overvalued. On the contrary, a low ratio might suggest that Gold is undervalued relative to Silver.
Recommended Articles


