


Bitcoin crosses $91,000 for first time in 50 days: Is Trump behind the latest rally?
- Bitcoin price broke above $91,000 on Tuesday for the first time in 52 days, dating back to March 2.
- Bitcoin ETFs recorded $381 million in inflows on Monday, signaling capital rotation from US equities to cryptocurrencies among US-based corporate investors.
- Technical indicators on the BTC/USD daily chart suggest a potential leg-up toward $95,000 if momentum holds.
Bitcoin price forecast hints at a $95,000 breakout as markets react to rising ETF demand and United States (US) President Donald Trump’s criticism of the Federal Reserve (Fed) Chair Jerome Powell.
Bitcoin price tops $91K as Trump escalates attack on Fed Chair Powell
Bitcoin’s price surged past $91,000 on Tuesday for the first time in 50 days, fueled by a mix of political factors and institutional demand.
A key catalyst behind the Bitcoin price rally is President Trump's criticism of Federal Reserve Chair Jerome Powell, which triggered volatility in traditional markets and redirected capital toward crypto markets.
Over the weekend, Trump accused Powell of “politicizing rate policy” and “sabotaging economic momentum”—comments that rattled equity and bond investors already navigating uncertainty around future interest rate moves.
Trump doubled down on this rhetoric on Monday. At a press conference, he said, “Powell should do the rate cuts because the European Central Bank has cut interest rates. I'm not happy with him—I let him know it. If I want him out, he’ll be outta there real fast. Believe me.”
Powell, for his part, has maintained that he intends to complete his term as Federal Reserve Chair, which is set to end on May 15, 2026.
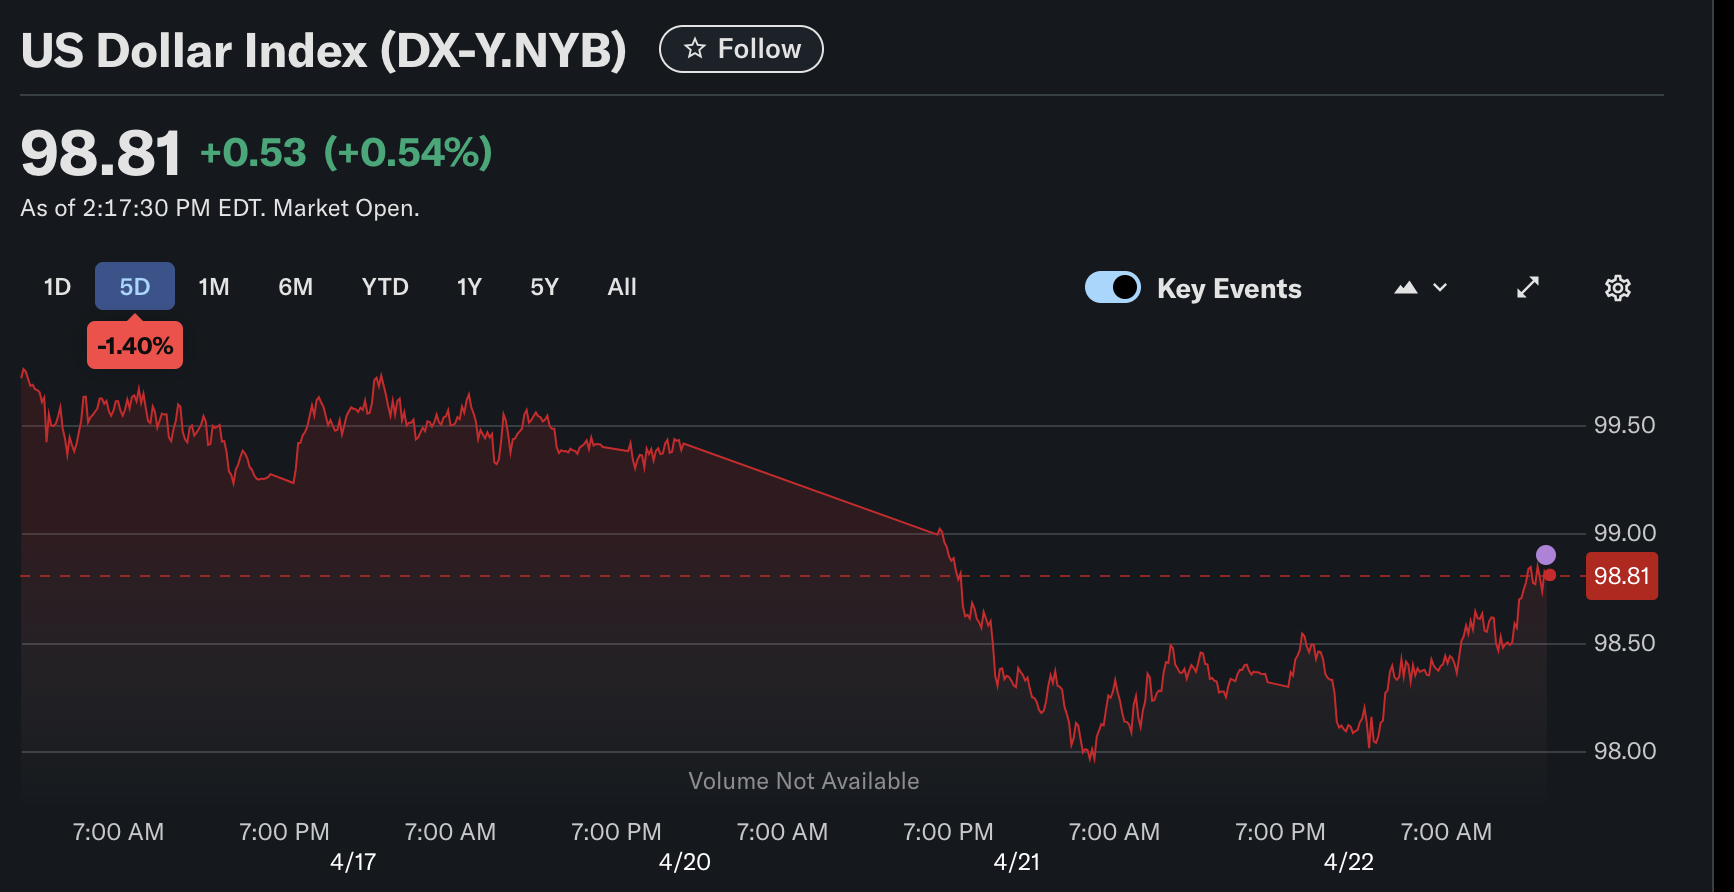
US Dollar Index Performance | Source: YahooFinance
The fallout from Trump’s remarks was swift. The US Dollar index (UDY) fell to a three-year low, briefly weakening to 97.923 against a basket of major currencies. Simultaneously, US government bonds came under pressure as investors offloaded traditional safe-haven assets. The yield on the 10-year Treasury note surged above 4.4%, reflecting growing investor unease over political interference in monetary policy.
Bitcoin ETF demand surges amid US markets turbulence
In contrast, Bitcoin gained more than 5% in the last 48 hours, buoyed by renewed risk appetite in the crypto sector. Analysts point to a “flight-to-alternative-assets” narrative, with spot Bitcoin ETFs in the US posting net inflows of $381 million over the past week.
Notably, this represents the highest single-day inflow since January 2025. A closer look at the FarSide data shows Ark Invest’s ARKB took in the largest inflow share with $116 million.
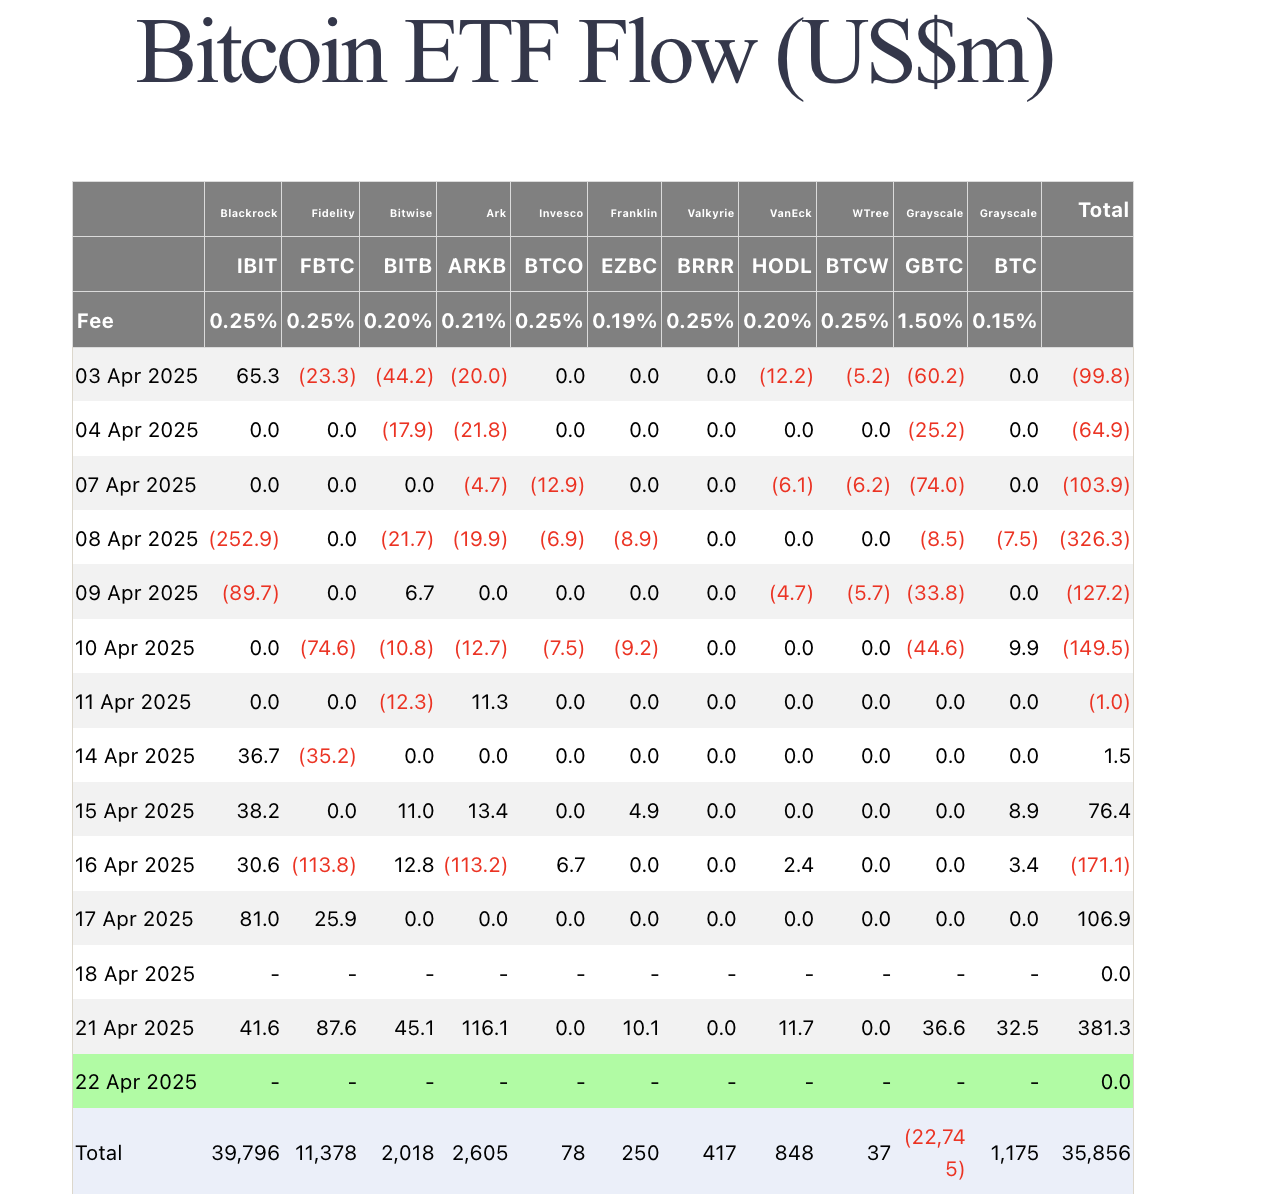
Bitcoin ETF Flows, April 22 | Source: Farside
BlackRock’s iShares Bitcoin Trust (IBIT) and Fidelity’s FBTC made up the top three buyers list with $41 million and $87 million inflow, respectively, on Monday.
Investor sentiment was further boosted by the appointment of Paul Atkins as the new Chair of the US Securities and Exchange Commission (SEC). Known for his market-liberal views and historical criticism of overregulation, Atkins’ confirmation marks a potential turning point for crypto oversight in the US.
In his inaugural statement, Atkins emphasized the need to establish a “comprehensive, innovation-supportive regulatory framework” for digital assets, vowing to prioritize clarity around spot ETFs, token classification, and DeFi protocols. The shift in tone from his predecessor, Gary Gensler, has already been met with cautious optimism across crypto markets.
Bitcoin Price Forecast Today: SMA line-up suggests $94,000 breakout ahead
Bitcoin price forecast on Tuesday leans bullish as BTC decisively broke past $91,000 for the first time in 50 days, confirming a strong breakout from a prolonged consolidation phase.
The 12-hour chart indicates a robust shift in momentum, with BTC trading well above the 5, 8, and 13-period SMAs, all of which are positively aligned and steepening—an established bullish signal suggesting sustained upside pressure.
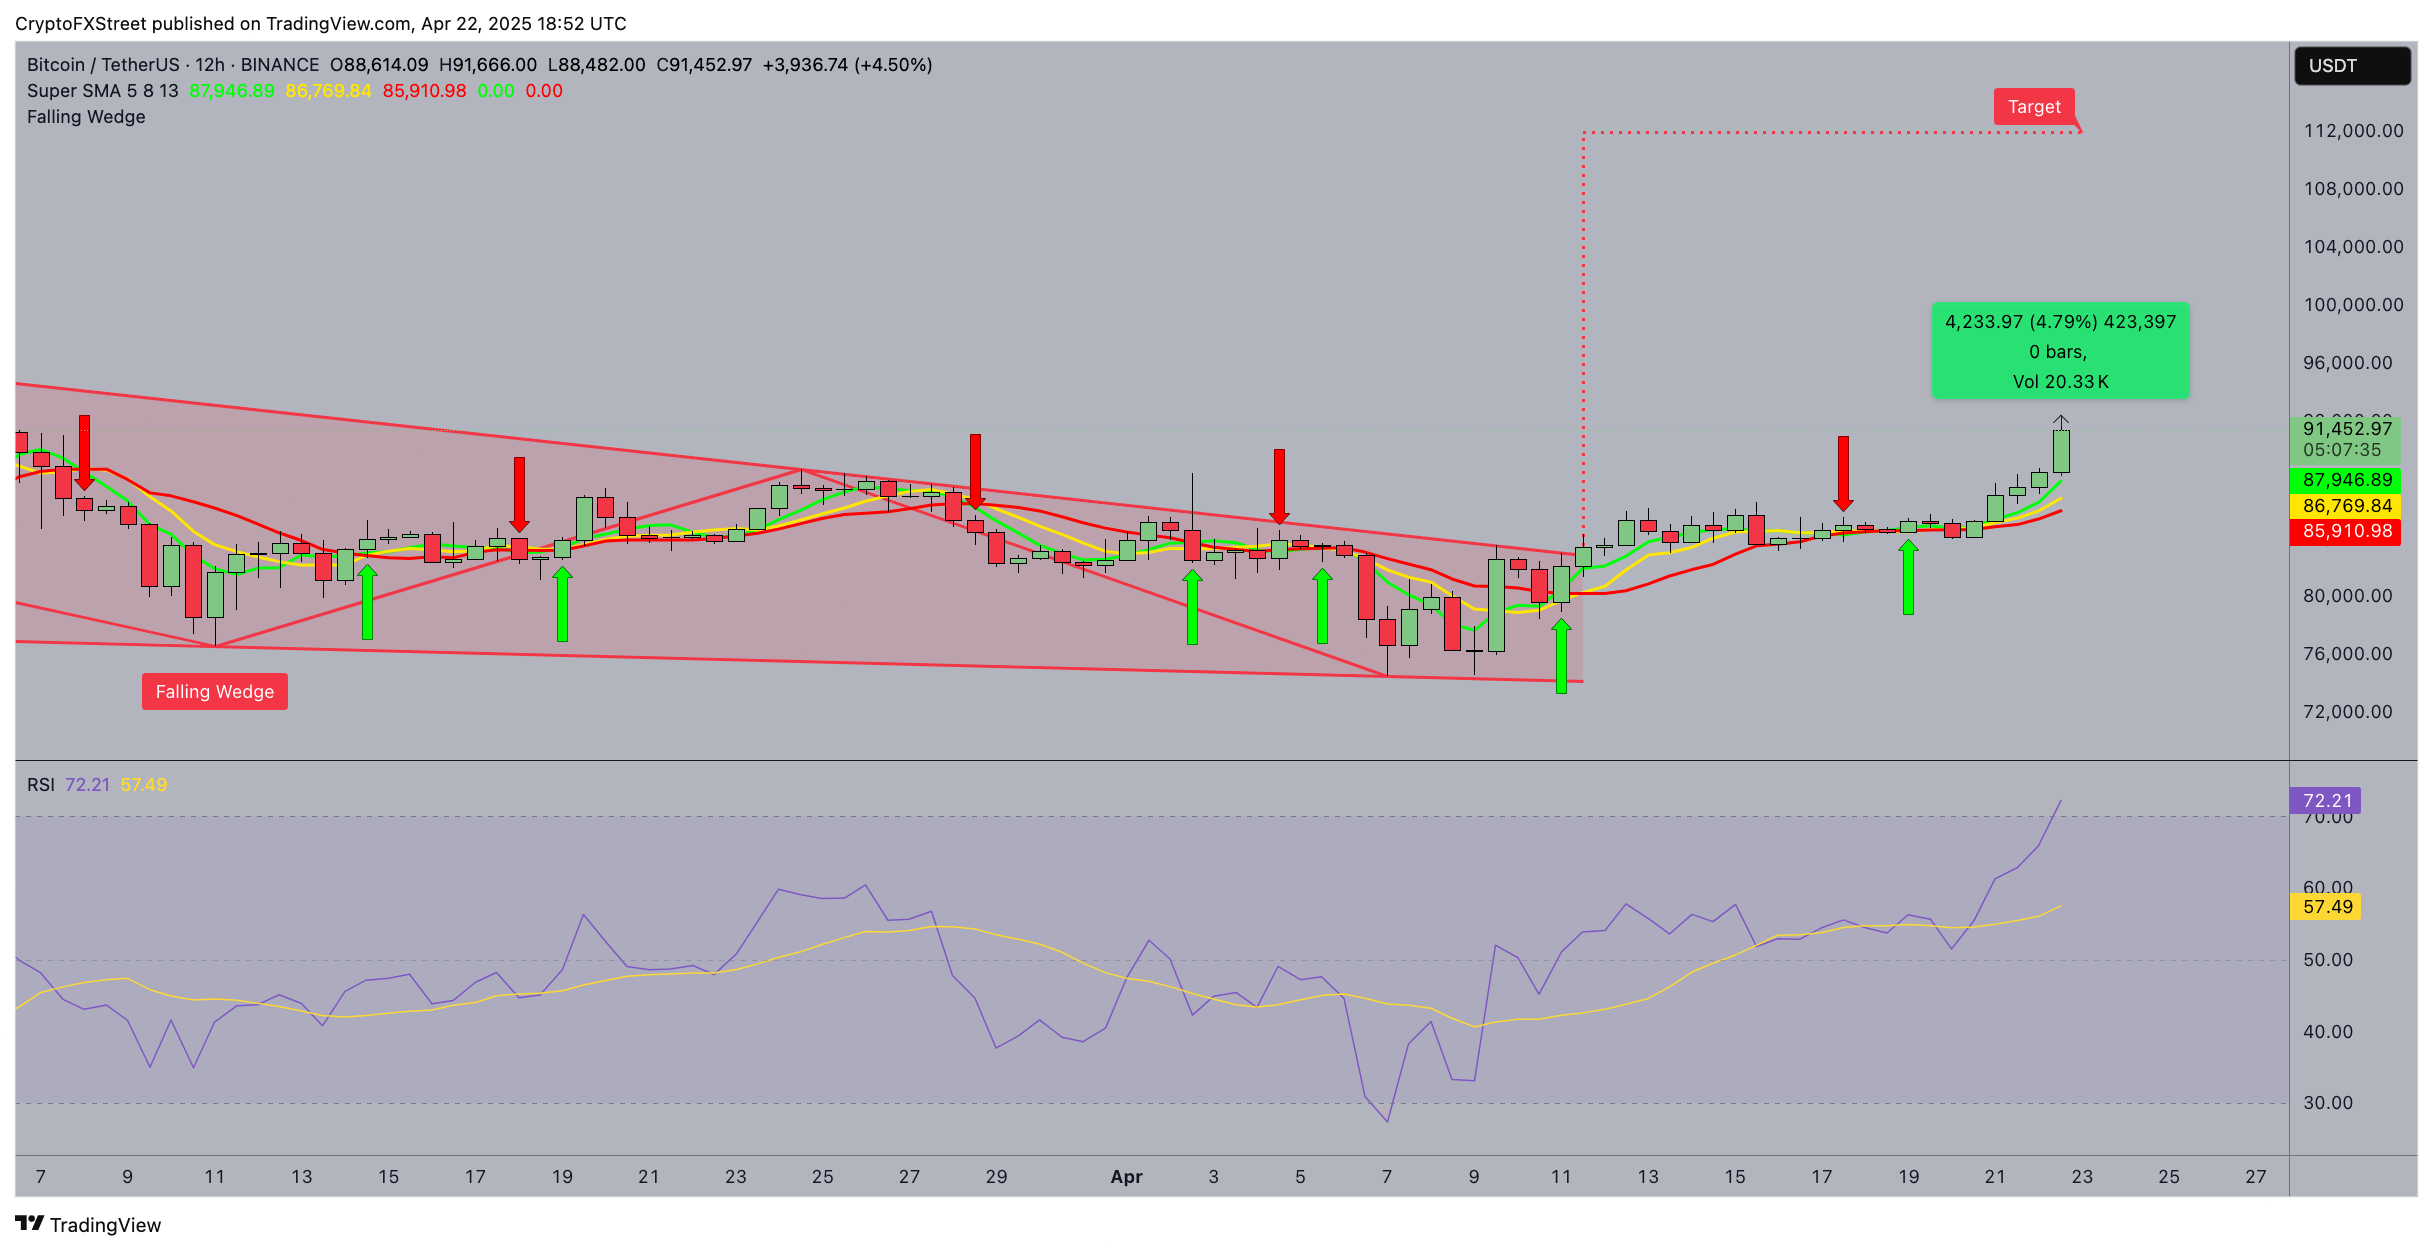
The most recent 12-hour candle posted a 4.93% gain, pushing the price into a region that has historically acted as resistance. Volume support appears solid at 15.7K, adding confirmation to the breakout strength. The RSI currently sits at 71.77, above the 70 threshold, implying overbought conditions—but rather than a reversal, this level often precedes further upside in trending markets. The RSI’s divergence from its moving average (now at 57.46) further emphasizes the current bullish bias.
While a retracement to the $87,900 support level remains possible, especially on profit-taking, the Bitcoin price targets $94,000 if momentum holds. Failure to hold close above $88,500 could negate this bullish outlook.
Recommended Articles


