

BNB price tops $570 as Binance receives $2 billion investment from Dubai
- BNB price kicked off Thursday’s trading at $570, marking its strongest opening of the week.
- Binance announced a $2 billion investment from Dubai-based firm MGX, according to a recent post on X.
- Rising trading volumes suggest that BNB prices could advance further before facing major resistance.
BNB price rose as high as $574 on Thursday as markets reacted to news that Binance received major investments from an Abu Dhabi based firm. Derivative markets analysis shows how BNB traders are repositioning amid the latest swings in market sentiment.
BNB climbs to three-day peak, driven by $2B Dubai investment and exchange token demand
Binance Coin (BNB) has surged to a 10-day high, capitalizing on two powerful catalysts: a $2 billion investment from Abu Dhabi-based MGX and renewed demand for exchange tokens.
While top assets like ETH and PEPE also reacted positively to the cooler U.S. inflation data published on Wednesday, BNB’s rally stands out, fueled by the aforementioned dual catalysts.
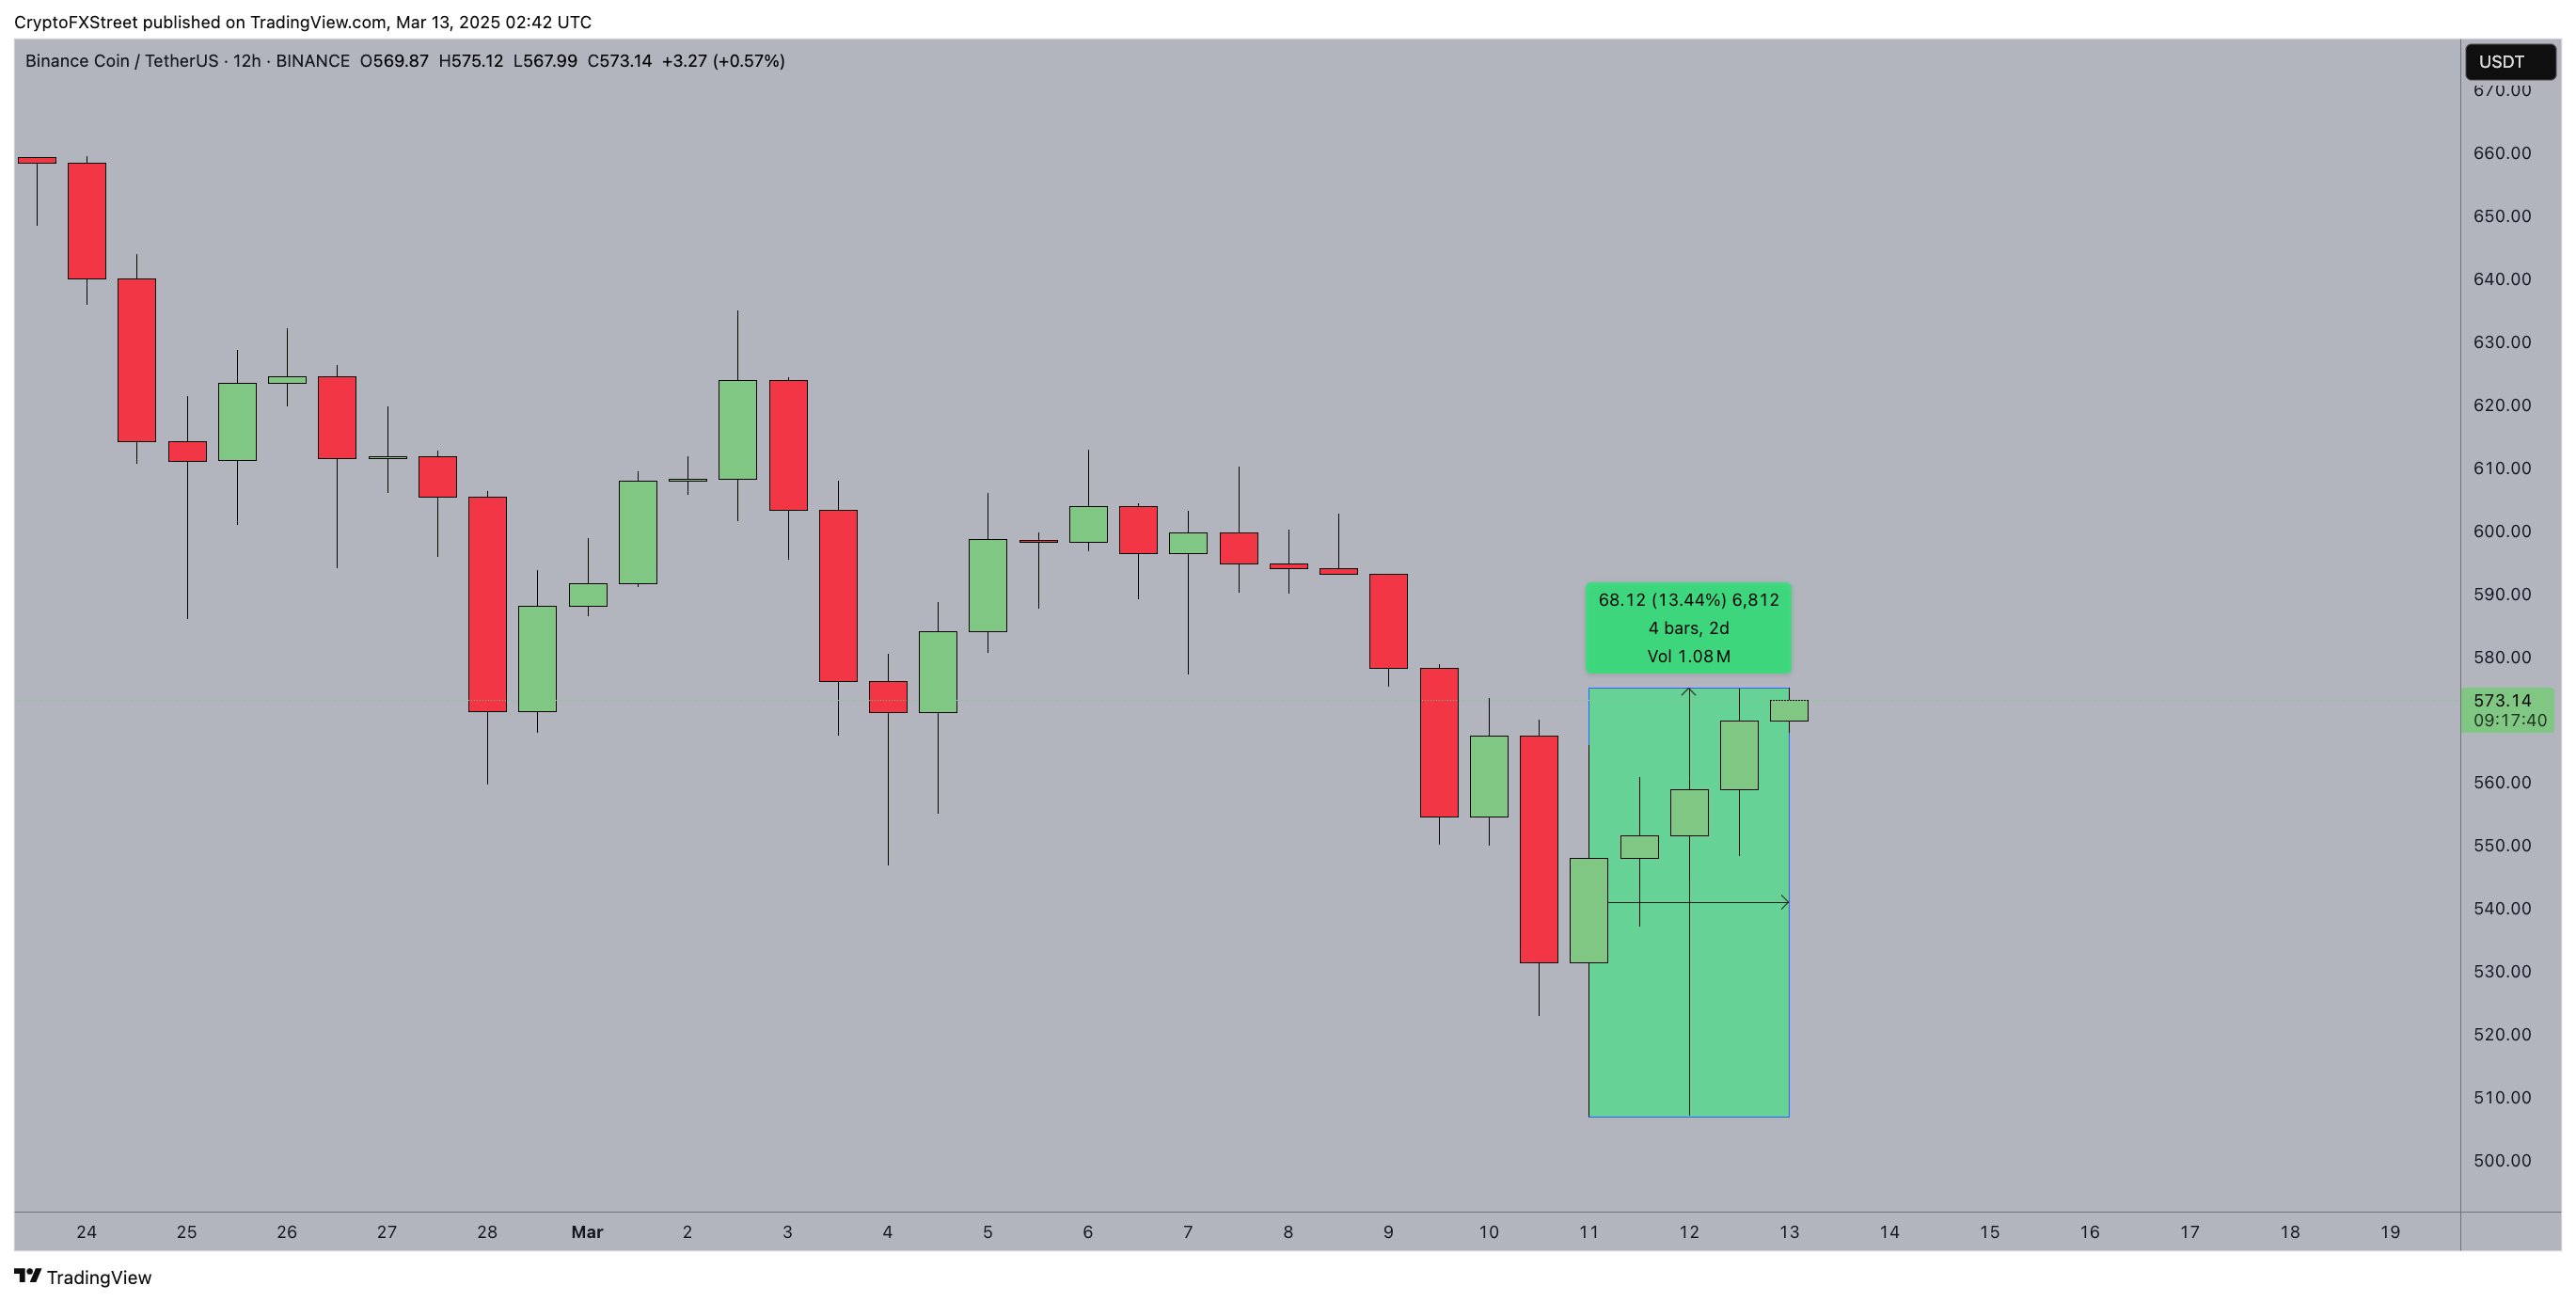
BNB price action | March 13
The chart above shows that BNB price kicked off Thursday’s trading at $570, marking its strongest opening of the week.
Zooming out, BNB price is now trading at $573 at press time up 13% from the recent lows of $507 recorded on Tuesday.
“This investment by MGX is a significant milestone for the crypto industry and for Binance. Together, we are shaping the future of digital finance.
Our goal is to build a more inclusive and sustainable ecosystem, with a strong focus on compliance, security, and user protection.
Binance remains committed to working with regulators worldwide to establish transparent, responsible, and forward-thinking policies for the crypto industry.
Our ongoing investments in security and compliance reinforce our mission to foster a secure and trusted digital financial ecosystem.”
- Binance CEO, Richard Teng, March 12, 2025
BNB’s bullish momentum aligns with growing appetite for exchange tokens, with investors seeking exposure to platforms with deep liquidity and regulatory clarity.
Binance’s dominant market position—handling over $100 trillion in cumulative trading volume—reinforces confidence in BNB’s long-term value.
With the UAE solidifying its role as a crypto hub, this investment could further expand demand for the BNB native token across the Middle East and Asia.
As BNB flirts with resistance at $570, the token remains primed for further upside.
Exchange tokens thrive in bullish cycles, and with institutional capital backing Binance’s expansion, BNB could be on the verge of another major breakout.
BNB Price Forecast: $600 breakout ahead if key support levels hold
BNB price leans bullish after reclaiming the midline of the Donchian Channel, signaling renewed buying pressure.
The recent 13.44% surge within four 12-hour candles reflects growing momentum, reinforced by the recent recovery from the lower boundary at $507. If bulls sustain this uptrend, the next major test lies at $612.
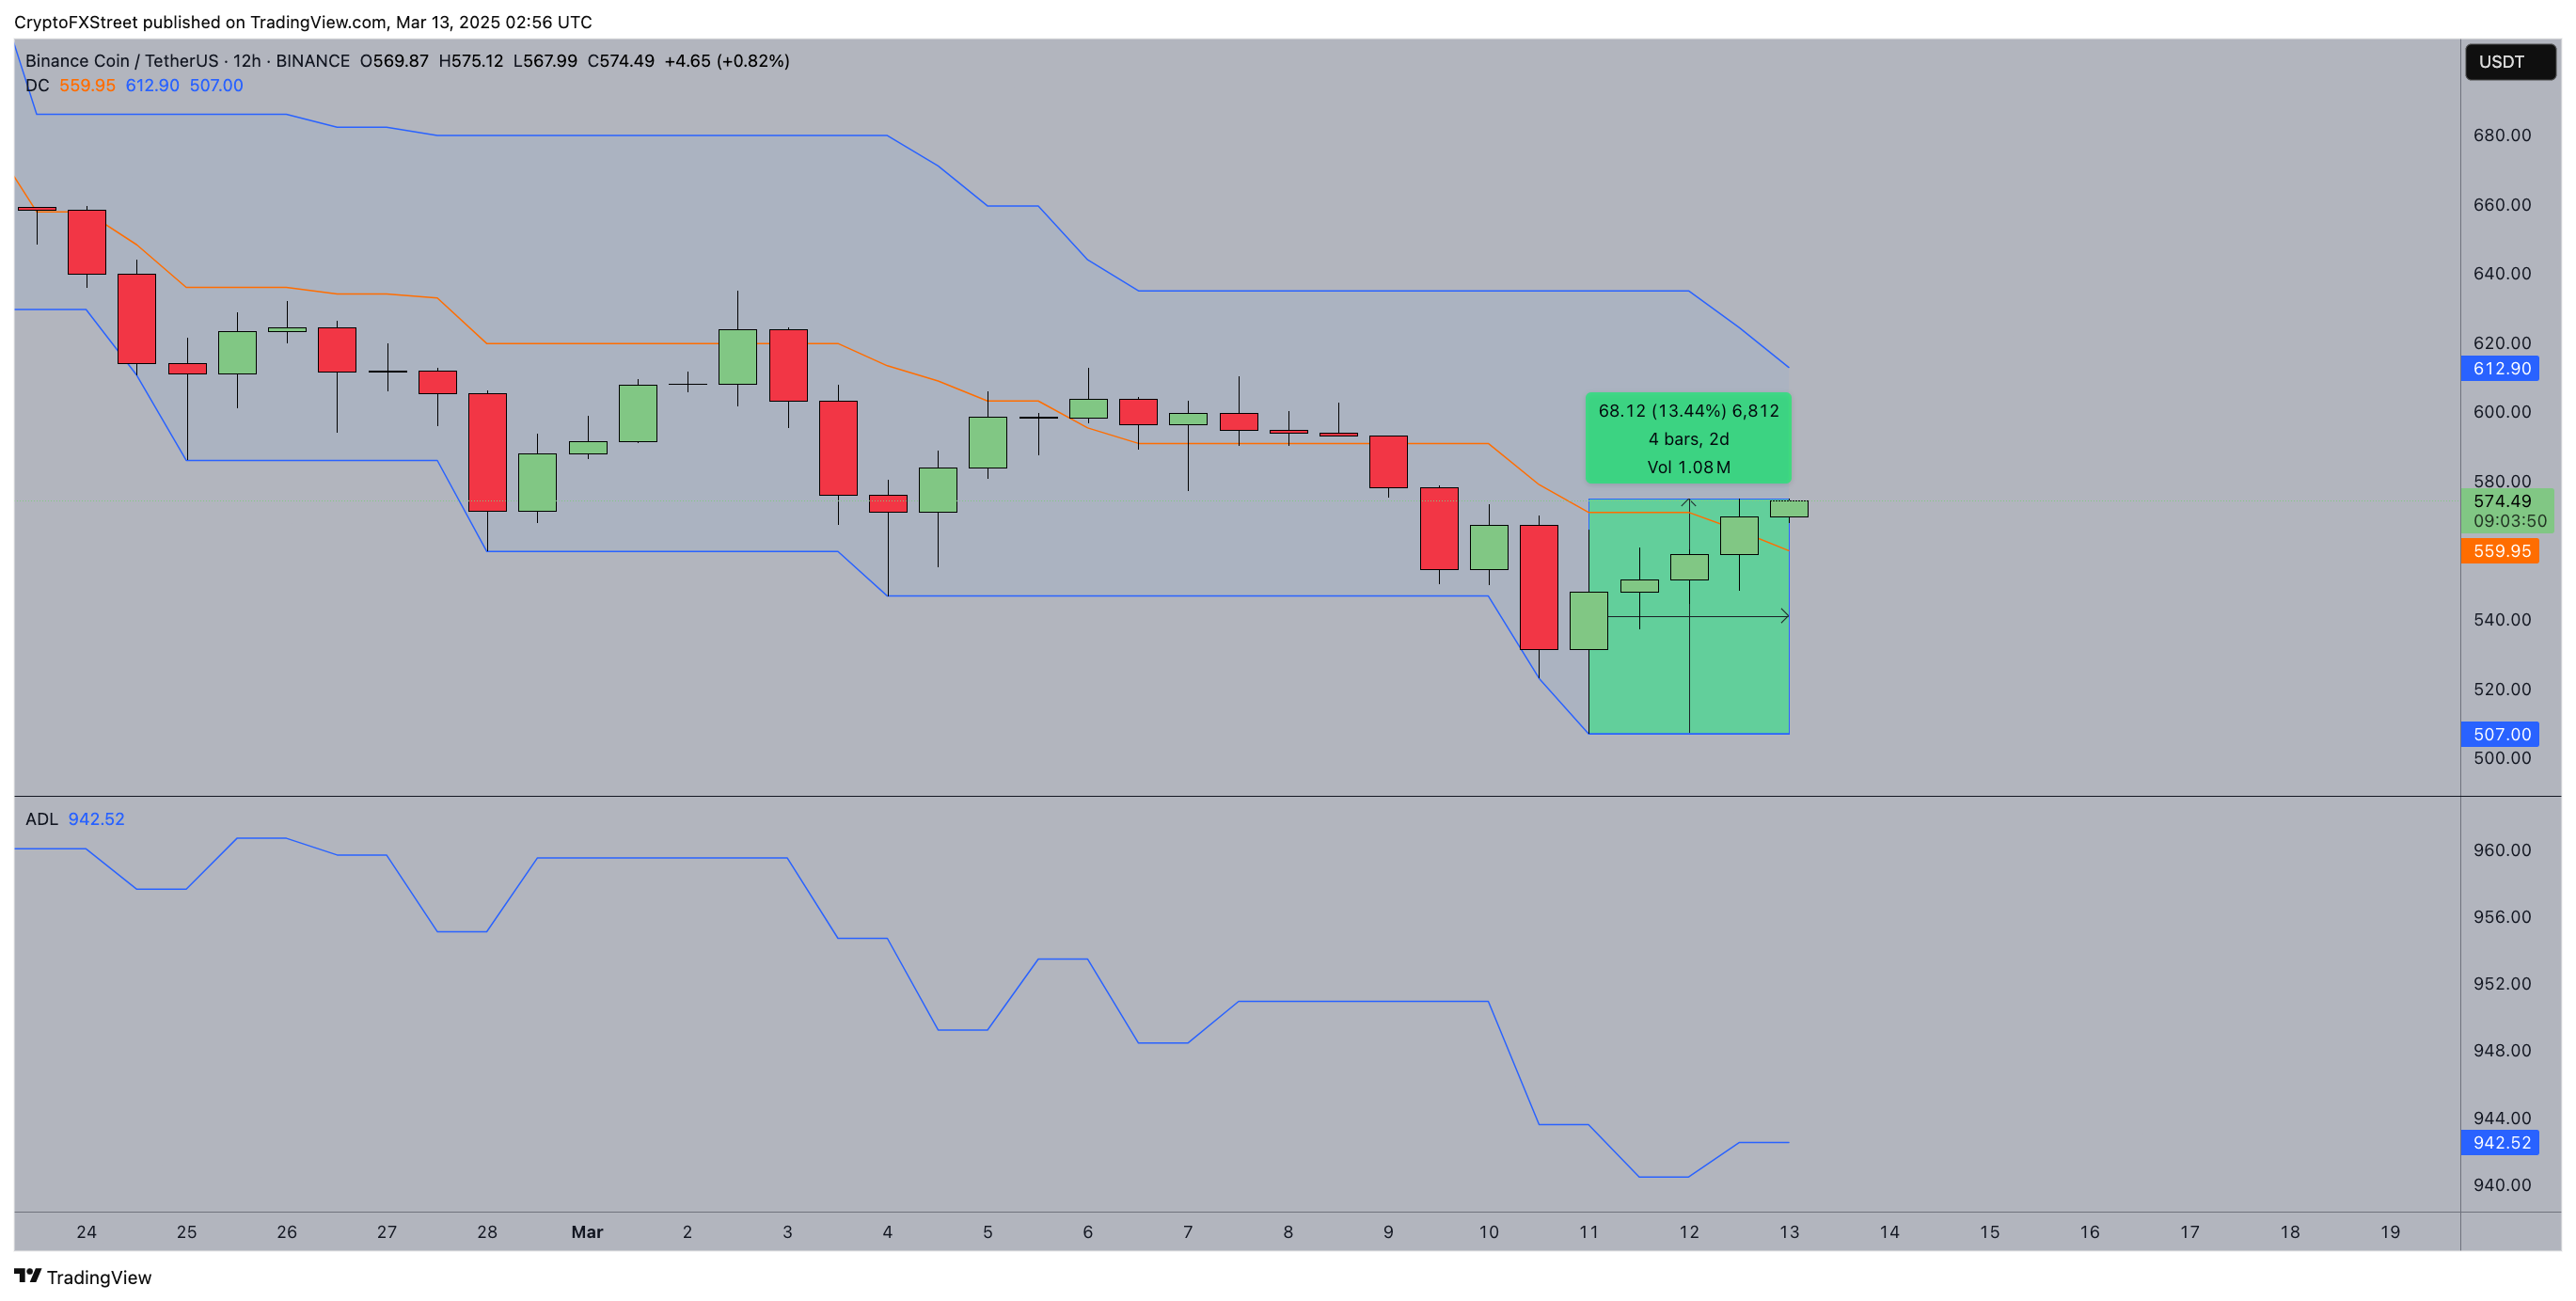
BNB Price Forecast
Beyond that, the Accumulation/Distribution Line (ADL) remains steady, hinting at consistent liquidity inflows rather than aggressive selling pressure.
In this case, failure to hold above $559—the channel’s median—could invite short-term pullbacks. Bears may attempt to retest $507, the local bottom formed earlier in the week.
However, sustained positive market sentiment that the US Federal Reserve could delay rate hikes.
A successful breach above $612 could trigger a cascading short squeeze of over-leveraged bear traders who deployed aggressive positions when markets plunged last week.
However, bulls need to confirm strength above $574 to invalidate bearish momentum and establish dominance.
Recommended Articles


