ApeCoin Price Prediction: An 8% fall seems likely for APE with multiple bearish signals at play

Source Fxstreet
  • ApeCoin price remains below the foothold of the centerline of the Bollinger indicator, with several other technical indicators flashing bearish.
  • APE could fall 8% to the $1.24 support level, last tested on January 23.
  • Invalidation of the bearish thesis will occur upon a candlestick close above $1.60.

ApeCoin (APE) price is trading with a bearish bias, trapped within the confines of the Bollinger indicator. With the upper and lower bands of this technical tool coming together, the volatility contraction could see APE record a bold move soon.

Also Read: ApeCoin price climbs 5% as gaming narrative revitalizes social metrics for APE

ApeCoin price coils up for a bold move

ApeCoin (APE) price is below the centerline of the Bollinger indicator at $1.38, with an analyst saying such a position could precede a move lower once the volatility contraction is over and volatility expansion takes place.

The position of the Relative Strength Index (RSI) below 50 accentuates the bearish outlook. This momentum indicator is not only southbound, pointing to falling momentum, but has also executed a sell signal after crossing below the signal line (yellow band).

Furthermore, both the Awesome Oscillator (AO) and the Moving Average Convergence Divergence (MACD) indicators are in negative territory, below their respective mean lines.

Increased selling pressure could see ApeCoin price drop to breach the lower band of the Bollinger indicator at $1.29.

An extended fall could see the altcoin’s market value roll over to the $1.24 support, levels last tested on January 23. Such a move would constitute an 8% drop below current levels.

In the dire case, the altcoin’s market value could dwindle all the way to the bottom of the market range at $1.02.


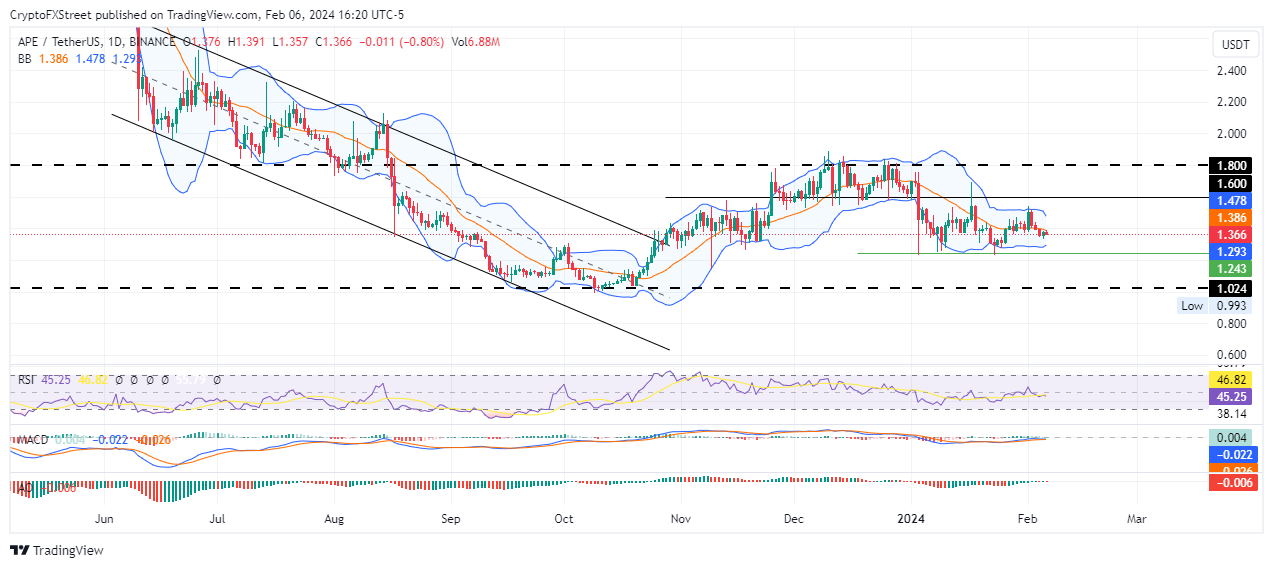
APE/USDT 1-day chart

On the other hand, if sidelined investors and late buyers buy the dip, the ensuing buyer momentum could see ApeCoin price push north. Overcoming the centerline would bring the upper band of the Bollinger indicator into focus at $1.47. A decisive breach of this supplier congestion level, confirmed by a stable close above the $1.60 threshold would invalidate the bearish thesis.

In a highly bullish case, ApeCoin price could extend a neck higher, tagging the $1.80 psychological level, 30% above current levels. 

Disclaimer: For information purposes only. Past performance is not indicative of future results.
placeholder
Gold price declines amid risk-on sentiment despite Fed rate cut expectationsGold price (XAU/USD) continues with its struggle to find acceptance above the $3,400 mark and attracts heavy selling during the Asian session on Monday.
Author  FXStreet
Aug 11, 2025
Gold price (XAU/USD) continues with its struggle to find acceptance above the $3,400 mark and attracts heavy selling during the Asian session on Monday.
placeholder
EUR/USD Price Forecast: Keeps bullish vibe above 1.1600 despite France’s deepening political crisisThe EUR/USD pair loses ground to near 1.1620 during the early European session on Monday.
Author  FXStreet
Oct 27, 2025
The EUR/USD pair loses ground to near 1.1620 during the early European session on Monday.
placeholder
ECB Policy Outlook for 2026: What It Could Mean for the Euro’s Next MoveWith the ECB likely holding rates steady at 2.15% and the Fed potentially extending cuts into 2026, EUR/USD may test 1.20 if Eurozone growth proves resilient, but weaker growth and an ECB pivot could pull the pair back toward 1.13 and potentially 1.10.
Author  Mitrade
Dec 26, 2025
With the ECB likely holding rates steady at 2.15% and the Fed potentially extending cuts into 2026, EUR/USD may test 1.20 if Eurozone growth proves resilient, but weaker growth and an ECB pivot could pull the pair back toward 1.13 and potentially 1.10.
placeholder
Gold plummets below $4,200 as US‑Iran tensions spur hawkish rate bets ahead of US CPIGold (XAU/USD) extends the recent breakdown momentum below a technically significant 200-day Simple Moving Average (SMA) and drops to a fresh low since March 23, further below the $4,200 mark during the Asian session on Wednesday.
Author  FXStreet
Yesterday 08: 26
Gold (XAU/USD) extends the recent breakdown momentum below a technically significant 200-day Simple Moving Average (SMA) and drops to a fresh low since March 23, further below the $4,200 mark during the Asian session on Wednesday.
placeholder
BTC Hovers Near 60,000 Mark After Plunge. US May CPI Set to Be Revealed, How Is Wall Street Betting?Bitcoin's rebound falters as the U.S.-Iran conflict and CPI data likely sustain downward pressure.On June 10, escalating U.S.-Iran tensions put the already fragile crypto market to the te
Author  TradingKey
Yesterday 09: 57
Bitcoin's rebound falters as the U.S.-Iran conflict and CPI data likely sustain downward pressure.On June 10, escalating U.S.-Iran tensions put the already fragile crypto market to the te
Related Instrument
goTop
quote