

Dogwifhat and BONK defy crypto market decline
- WIF and BONK are up about 6% in the past 24 hours.
- The meme coin market cap is down nearly 6% following declines sustained in DOGE, SHIB and PEPE.
- WIF could rally toward $2.939 if it smashes resistance near $2.643.
Solana meme coins dogwifhat (WIF) and BONK are among the top gainers in the top 100 cryptocurrencies category on Monday following defiance of the market downturn in the past 24 hours.
WIF could continue impressive run despite wider crypto market downturn
The meme coin category lost 5.8% of its market capitalization in the past 24 hours following declines of 7%, 9% and 4% in top meme coins Dogecoin (DOGE), Shiba Inu (SHIB) and PEPE, respectively.
While the meme category often suffers a setback when the top three take losses, WIF and BONK have defied the market drawdown, increasing about 6% in the past 24 hours.
Notably, WIF has been in an uptrend since the Federal Reserve (Fed) reduced rates by 50 basis points last Wednesday. WIF has soared over 65% during the period, outperforming nearly every other token in the top eight meme coins category, per Coingekco's data.
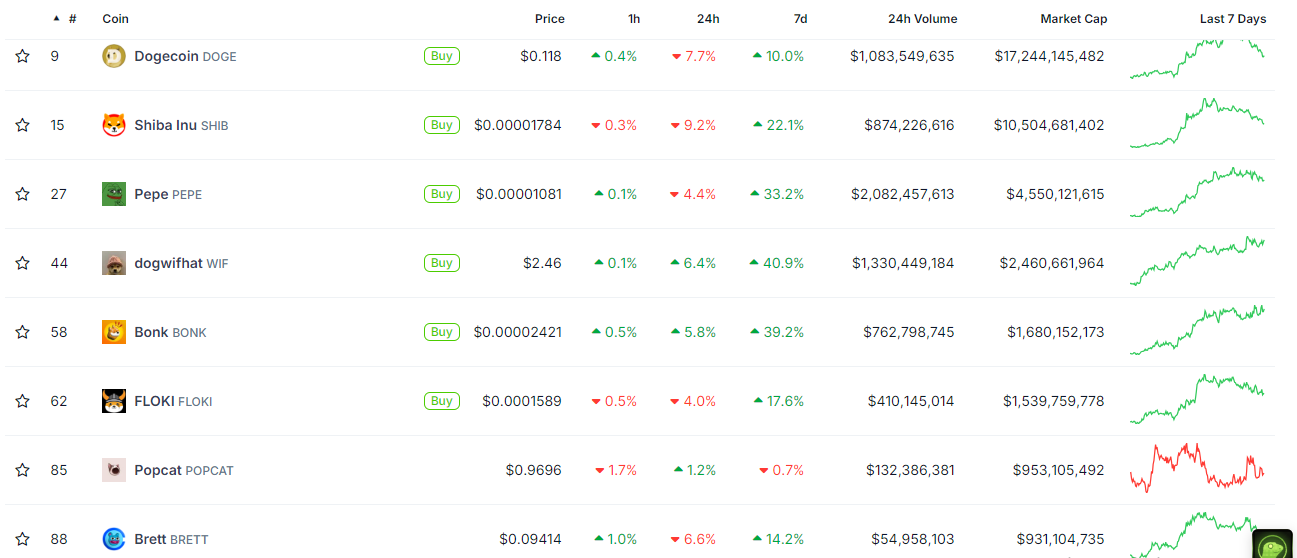
Top eight meme coins
WIF could rally to $2.939 if it moves above key resistance
The rise also saw WIF breaking out of a downtrend visualized by a key trendline extending from May 29 and flipping the 50-day, 100-day and 200-day Simple Moving Averages (SMA). As a result, the top Solana meme coin is seeing heightened bullish momentum.
On the 4-hour chart, WIF is trading within key rectangle channels and aiming to tackle the resistance around $2.643. A successful move above this level could send WIF toward another key resistance level at $2.939. If the uptrend continues, WIF could break above this level and rally toward the resistance at $3.472.
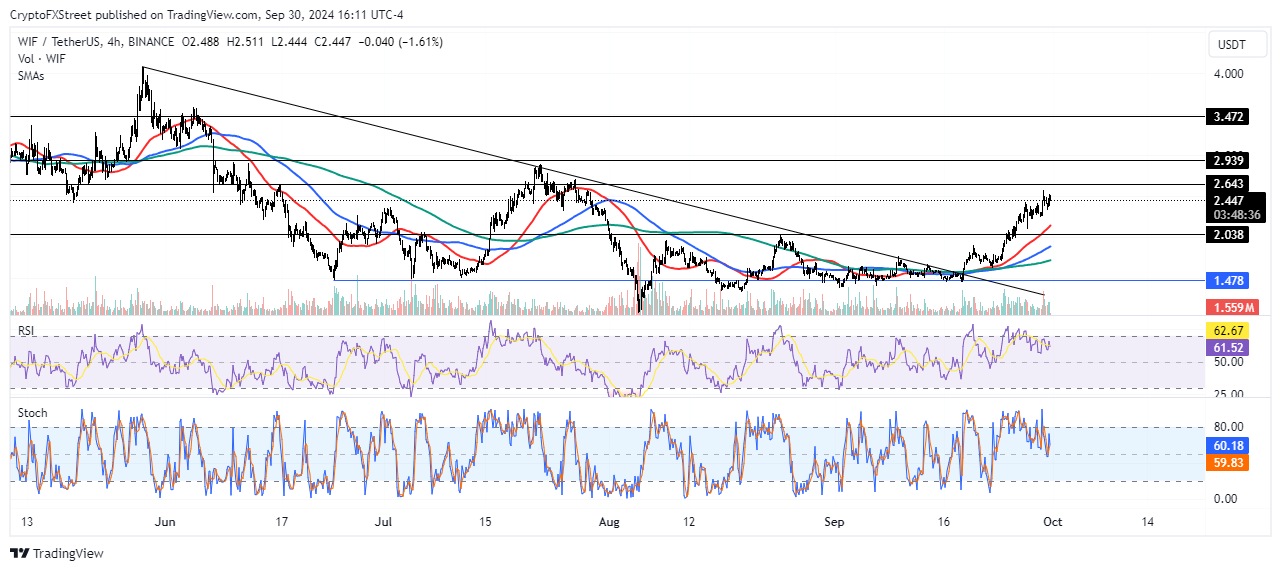
WIF/USDT 4-hour chart
On the downside, the SMAs could provide support to prevent any sharp decline.
The Relative Strength Index (RSI) and Stochastic Oscillator momentum indicators are above their neutral levels and approaching the oversold region, indicating prevailing bullish pressure.
WIF's rising futures open interest (OI) supports the price growth.
Open interest is the total number of unsettled outstanding positions in a derivatives market. Rising open interest during price growth indicates traders expect the trend to continue.
WIF's OI neared a four-month high of $439.43 million on Monday, the highest level since June 7.
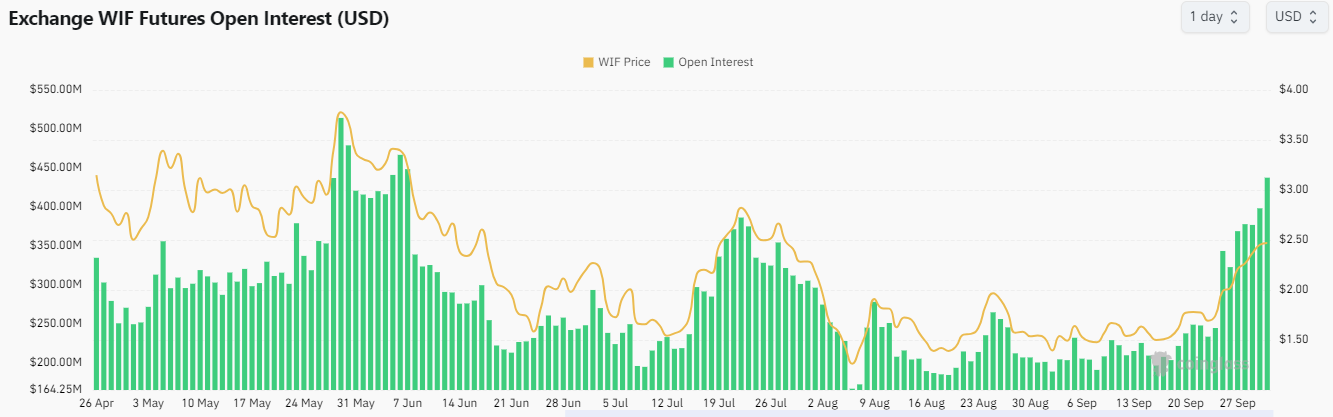
WIF Futures Open Interest
A candlestick close below $2.038 will invalidate the bullish thesis.
Recommended Articles


