

Dow Jones Industrial Average rises as markets hope for trade deals
- The Dow Jones Industrial Average was dragged higher by tech gains on Tuesday.
- Lacking any meaningful news, investors are hoping that Trump’s tech blockade on China will spring a leak.
- Trade tensions are still on the rise as the US and China crash heads over preliminary trade deal terms.
The Dow Jones Industrial Average (DJIA) rose on Tuesday, bolstered by endless optimism in the tech sector. AI rally frontrunner Nvidia (NVDA) led a chip-based market advance, surpassing Microsoft’s market cap for the first time since January. An unexpected but welcome upswing in JOLTS Job Openings in April helped further bolster investor feelings, who shrugged off a worse-than-expected contraction in Factory Orders during the same period.
Traders lean into bets of another Trump trade pivot
Investors continue to bank on an eventual trade deal between President Trump and China’s Xi Jinping, despite still-escalating trade tensions as the two sides lob accusations of violating preliminary trade agreement terms. Trump administration staff continue to insist that Trump and Xi will be speaking directly soon, but specific details remain limited.
White House Press Secretary Karoline Leavitt confirmed on Tuesday that the Trump team had sent a hardball letter to key US trade partners, as reported earlier this week. The letter demands that countries put their “best offer” on the table in terms of trade deals by Wednesday for the Trump team to consider. President Trump’s temporary delay of his own “reciprocal tariffs” package is set to expire in early July, and despite insistence that multiple major trade deals are “ready to be announced”, very little in the way of tariff-averting trade agreements have been forthcoming.
Despite upbeat market sentiment, policymakers remain cautious
Federal Reserve (Fed) policymakers remain apprehensive about the future state of the US economy in a post-tariff environment, and the Fed’s latest discount rate meeting minutes reveal much of the same stance from a growing number of US business operators. It’s still too soon to see much in the way of immediate tariff impacts; however, the Organization for Economic Co-operation and Development (OECD) has downgraded its growth forecast for the US economy this year to 1.6% from 2.2%.
JOLTS Job Openings rose to 7.391M in April, flouting the forecast backslide to 7.1M. On the other side of the data coin, US Factory Orders contracted more than expected in April, falling 3.7% MoM, their lowest figure in 15 months. The previous month also saw a sharp downward revision, slipping to 3.4% from the initial print of 4.3%.
US ISM Services Purchasing Managers Index (PMI) survey results are due on Thursday, and investors are hoping for a slight recovery in aggregate business operator sentiment. May’s ISM Services PMI print is forecast to rise to 52.0 from April’s 51.6.
Dow Jones price forecast
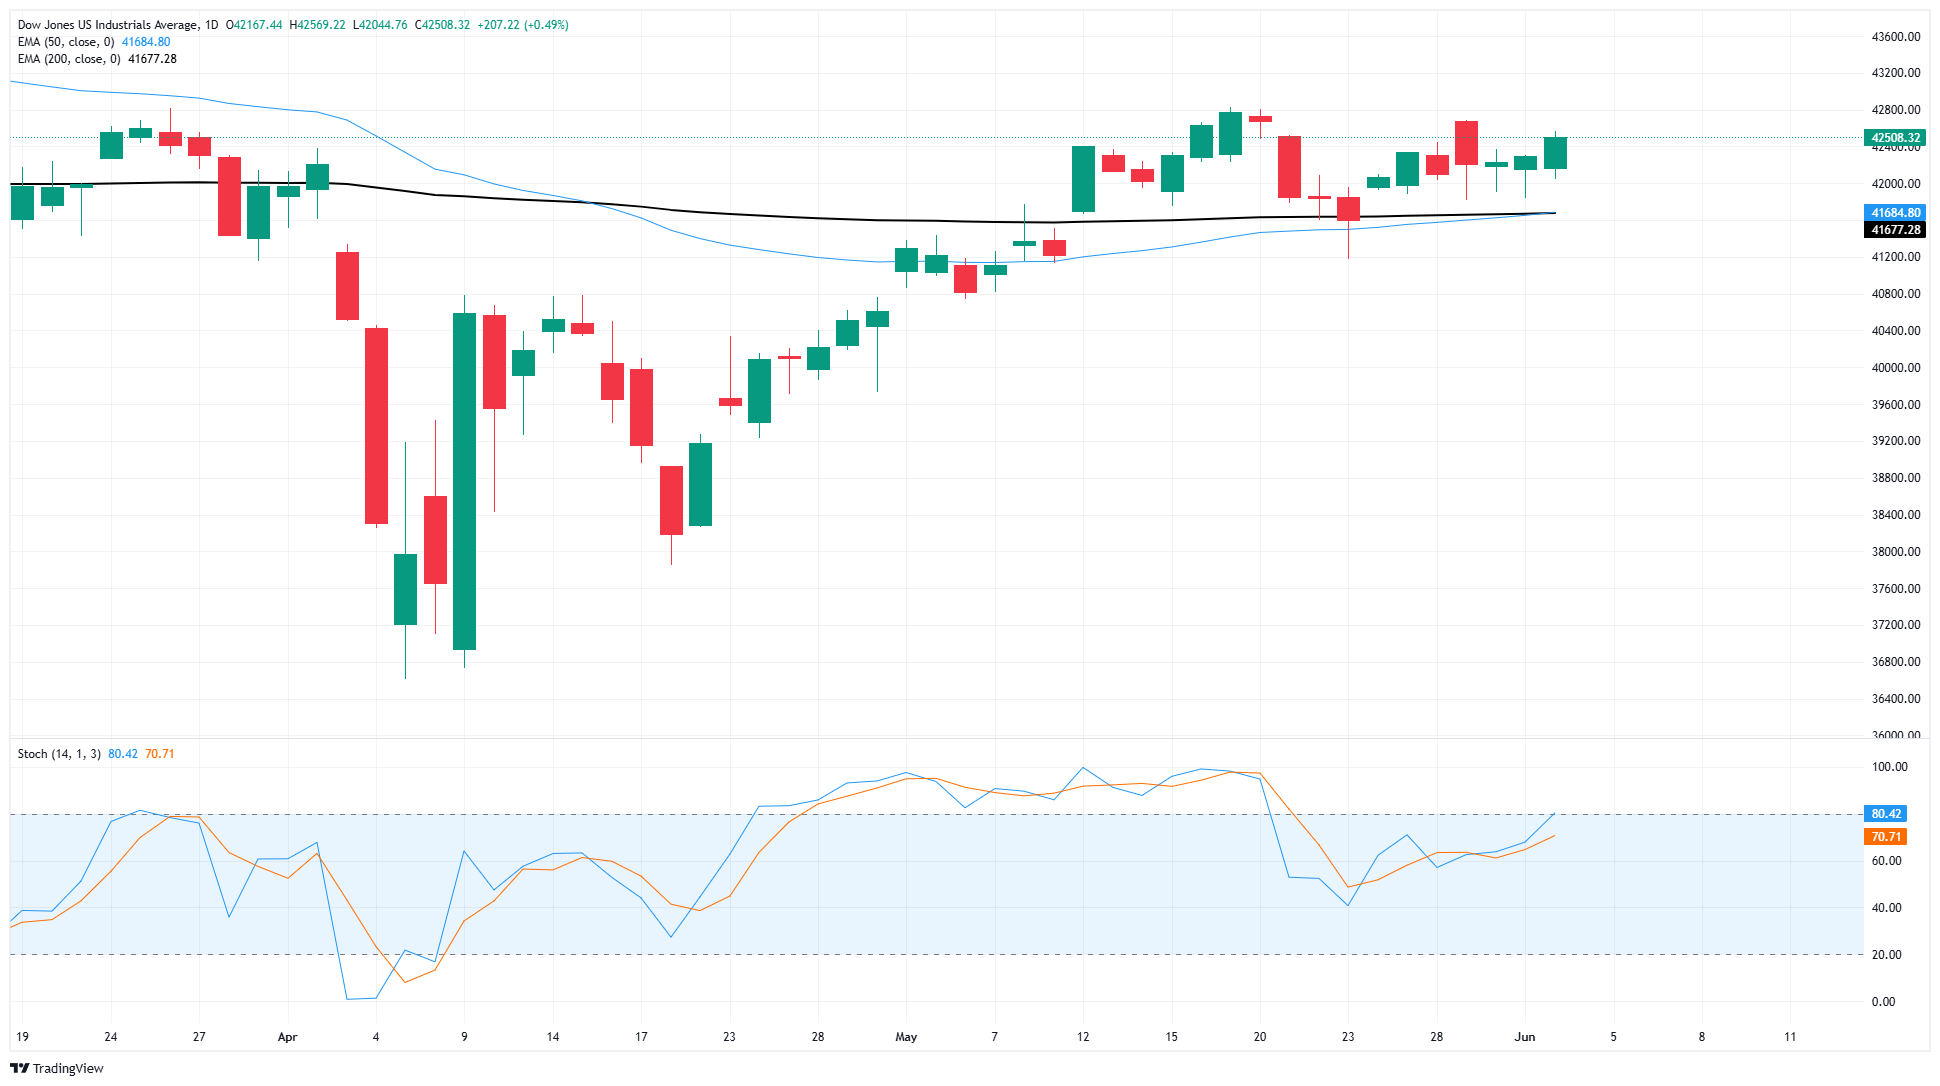
Despite an intraday rise on tech and trade hopes, the Dow Jones remains in a congestion zone between 42,000 and 43,000. The major equity index recaptured 42,500 after testing the low side earlier this week, and investors continue to tilt toward the steady side.
The Dow Jones Industrial Average is still trading on the high side of the 200-day Exponential Moving Average (EMA) near 41,675. However, technical oscillators are leaking into overbought territory, which could open the door for a technical correction to the downside.
Dow Jones daily chart
Dow Jones FAQs
The Dow Jones Industrial Average, one of the oldest stock market indices in the world, is compiled of the 30 most traded stocks in the US. The index is price-weighted rather than weighted by capitalization. It is calculated by summing the prices of the constituent stocks and dividing them by a factor, currently 0.152. The index was founded by Charles Dow, who also founded the Wall Street Journal. In later years it has been criticized for not being broadly representative enough because it only tracks 30 conglomerates, unlike broader indices such as the S&P 500.
Many different factors drive the Dow Jones Industrial Average (DJIA). The aggregate performance of the component companies revealed in quarterly company earnings reports is the main one. US and global macroeconomic data also contributes as it impacts on investor sentiment. The level of interest rates, set by the Federal Reserve (Fed), also influences the DJIA as it affects the cost of credit, on which many corporations are heavily reliant. Therefore, inflation can be a major driver as well as other metrics which impact the Fed decisions.
Dow Theory is a method for identifying the primary trend of the stock market developed by Charles Dow. A key step is to compare the direction of the Dow Jones Industrial Average (DJIA) and the Dow Jones Transportation Average (DJTA) and only follow trends where both are moving in the same direction. Volume is a confirmatory criteria. The theory uses elements of peak and trough analysis. Dow’s theory posits three trend phases: accumulation, when smart money starts buying or selling; public participation, when the wider public joins in; and distribution, when the smart money exits.
There are a number of ways to trade the DJIA. One is to use ETFs which allow investors to trade the DJIA as a single security, rather than having to buy shares in all 30 constituent companies. A leading example is the SPDR Dow Jones Industrial Average ETF (DIA). DJIA futures contracts enable traders to speculate on the future value of the index and Options provide the right, but not the obligation, to buy or sell the index at a predetermined price in the future. Mutual funds enable investors to buy a share of a diversified portfolio of DJIA stocks thus providing exposure to the overall index.
Recommended Articles


