

US Dollar prices in more Trump trade as Republicans win House majority
- The Trump trades rally in the US Dollar is heading into its fifth day of gains.
- All eyes are on Fed Chairman Powell and his view on the interest rate cut in December.
- The US Dollar index jumps to a fresh year-to-date high at around 107.00.
The US Dollar (USD) extends the Trump trade rally for the fifth consecutive trading day with the US Dollar Index (DXY), which gauges the Greenback’s value against six major currencies, reaching the highest level seen since November 1, 2023, above 107.00. The additional push comes after major news agencies reported on Wednesday evening that the Republicans had secured enough seats for a majority in the House of Representatives after already winning the Senate. Thus, The “Red Sweep” has materialized, and President-elect Donald Trump will face very few issues or struggles to get any package through both political decision bodies.
The US economic calendar includes the weekly Initial Jobless Claims and the Producer Price Index (PPI) inflation data for October. No big shakeups are expected from the PPI release after the US October Consumer Price Index (CPI) aligned with economist expectations on Wednesday. Instead, expect some nervousness from Federal Reserve (Fed) Chairman Jerome Powell’s speech after several Fed members questioned this week whether a December rate cut is still valid under current market conditions.
Daily digest market movers: December in the balance
- Macroeconomic data is set to be released at 13:30 GMT on Thursday:
- Weekly Initial Jobless Claims for the week ending on November 8 are expected to rise to 223,000, following the 221,000 reported in the previous week.
- The Producer Price Index (PPI) data for October will be released at the same time:
- The monthly headline PPI is expected to increase 0.2% from 0.0% previously. The monthly core PPI is expected to accelerate 0.3% compared to 0.2% in September.
- The yearly headline PPI is expected to surge 2.3% from 1.8% in September. The yearly core PPI is expected to surge 3.0% in October from 2.8% the prior month.
- Two Federal Reserve members and the Fed Chairman itself are set to speak this Thursday:
- At 12:00 GMT, Federal Reserve Governor Adriana Kugler (2024 FOMC voting member) delivers a speech about central bank independence and economic outlook at the Latin American and Caribbean Economic Association 2024 meeting in Montevideo, Uruguay.
- Richmond Fed President Tom Barkin discusses the economy with Jodie W. McLean, secretary of the Real Estate Roundtable board of directors at around 14:00 GMT.
- At 20:00 GMT, Federal Reserve Chair Jerome Powell participates in a panel discussion titled "Global Perspectives" about the economic outlook at an event hosted by the Federal Reserve Bank of Dallas.
- New York Fed President John Williams closes off this Thursday by delivering keynote remarks on "Intermediating Impact: Making Missing Markets" at a New York Fed event at 21:15 GMT.
- Equities are in a geographically split division, with Asian equities on the backfoot at their close on Thursday, while European and US equities are in the green.
- The CME FedWatch Tool is pricing in another 25 basis points (bps) rate cut by the Fed at the December 18 meeting by 82.5%. A 17.5% chance is for rates to remain unchanged. While the rate-cut scenario is the most probable, traders have pared back some of the rate-cut bets compared with a week ago.
- The US 10-year benchmark rate trades at 4.46%, just off the high printed at opening at 4.48%.
US Dollar Index Technical Analysis: Where to go from here
The US Dollar Index (DXY) extends gains this week after President-elect Donald Trump will have his presidency with full support from the Senate and the House of Representatives after Republicans secured enough seats. The only element now in the balance is whether December will still have a rate cut, while everything else known is priced in for now.
From now on, the 107.00 round level comes into play for the rest of the week. A fresh year-to-date high has already been printed. A full one-year high could be reached once 107.35 gets taken out.
On the downside, a fresh set of support is coming live. The first support is 105.89, the closing level on Tuesday. A touch lower, the pivotal 105.53 (April 11 high) should avoid any downturns towards 104.00 for now.
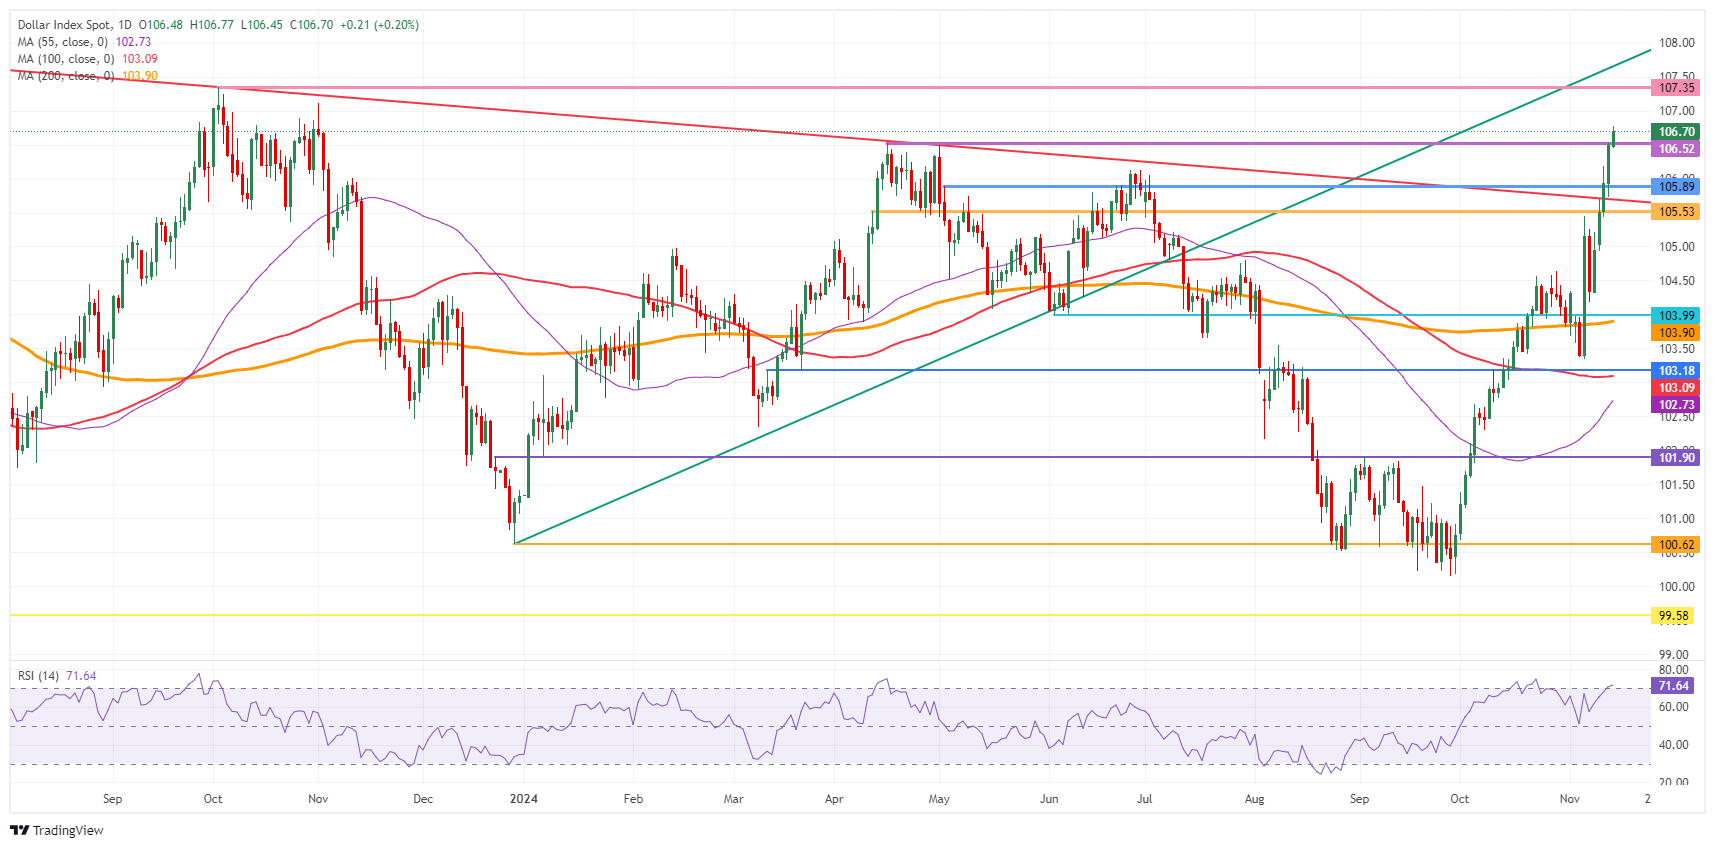
US Dollar Index: Daily Chart
US Dollar FAQs
The US Dollar (USD) is the official currency of the United States of America, and the ‘de facto’ currency of a significant number of other countries where it is found in circulation alongside local notes. It is the most heavily traded currency in the world, accounting for over 88% of all global foreign exchange turnover, or an average of $6.6 trillion in transactions per day, according to data from 2022. Following the second world war, the USD took over from the British Pound as the world’s reserve currency. For most of its history, the US Dollar was backed by Gold, until the Bretton Woods Agreement in 1971 when the Gold Standard went away.
The most important single factor impacting on the value of the US Dollar is monetary policy, which is shaped by the Federal Reserve (Fed). The Fed has two mandates: to achieve price stability (control inflation) and foster full employment. Its primary tool to achieve these two goals is by adjusting interest rates. When prices are rising too quickly and inflation is above the Fed’s 2% target, the Fed will raise rates, which helps the USD value. When inflation falls below 2% or the Unemployment Rate is too high, the Fed may lower interest rates, which weighs on the Greenback.
In extreme situations, the Federal Reserve can also print more Dollars and enact quantitative easing (QE). QE is the process by which the Fed substantially increases the flow of credit in a stuck financial system. It is a non-standard policy measure used when credit has dried up because banks will not lend to each other (out of the fear of counterparty default). It is a last resort when simply lowering interest rates is unlikely to achieve the necessary result. It was the Fed’s weapon of choice to combat the credit crunch that occurred during the Great Financial Crisis in 2008. It involves the Fed printing more Dollars and using them to buy US government bonds predominantly from financial institutions. QE usually leads to a weaker US Dollar.
Quantitative tightening (QT) is the reverse process whereby the Federal Reserve stops buying bonds from financial institutions and does not reinvest the principal from the bonds it holds maturing in new purchases. It is usually positive for the US Dollar.
Recommended Articles


