

US Dollar falters after US presidential election polls shift towar...
- The US Dollar drops after Ipsos polls show Vice President Kamala Harris taking the lead as the US presidential election looms.
- Traders gear up for a very volatile week, with the Fed meeting and the US presidential election as the main drivers.
- The US Dollar index slides below 104.00 and is looking for support.
The US Dollar (USD) slides on Monday, opening weaker across the board in Asia, after a final poll publication from ABC News and Ipsos showed Vice President Kamala Harris leading by 49% against 46% for former President Donald Trump. Another element for more US Dollar weakness comes from The New York Times, which released data pointing that Harris is ahead in five of the seven swing states that will determine the outcome of the US presidential election.
The US economic calendar, meanwhile, needs to be considered as well with a very interesting element ahead this Monday: the Senior Loan Officer Opinion Survey (SLOOS) for the third quarter. The report will tell more on the conditions, supply and demand of loans extended to customers in the US. Loan distribution is a very good leading indicator to sketch how the economy will evolve in the coming weeks and months.
Daily digest market movers: Polls publications
- On Sunday night, the final poll from ABC News and Ipsos showed Vice President Kamala Harris leading by a 49%-46% edge nationally. The New York Times/Siena survey showed Harris being ahead in five of the seven swing states.
- Factory Orders for September are due at 15:00 GMT. Expectations are for orders to contract by 0.4% against the previous decline of 0.2%.
- The Senior Loan Officer Opinion Survey (SLOOS) for the third quarter will be published at 19:00 GMT.
- Chinese equities are very happy with the positive Harris polls and have closed in the green on Monday. European equities and US equity futures are still looking for direction.
- The CME FedWatch Tool is backing a 25 basis point (bps) interest-rate cut on Thursday’s meeting with a 99.7% probability against a marginal 0.3% chance of rates remaining stable.
- The US 10-year benchmark rate trades at 4.30%, lower than the 4.38% where it closed on Friday.
US Dollar Index Technical Analysis: Forget all logic
The US Dollar Index (DXY) is set to enter a rough patch of volatility this week, so precautionary measures are needed when trading the US Dollar. Expect to see massive swings, mostly headline driven with even possibly unclear direction and rapid moves days after the election. Bigger levels – such as 102.11 on the downside and 105.53 on the upside – need to be considered as possible outcomes.
The DXY has given up two key levels on Monday and needs to regain control of those two levels first, before considering recovering toward 105.00 and higher. First up is the 200-day Simple Moving Average (SMA) at 103.84 together with the 104.00 big figure. The second element is the high of last week at 104.63.
On the downside, the 100-day SMA at 103.12, together with the pivotal level at 103.18 (high from March 12) are the first line of defence. In case of rapid and volatile moves this week, rather look for 101.90 together with the 55-day SMA at 102.11 to consider as a substantial support level. In case that level snaps, an excursion below 101.00 could be possible.
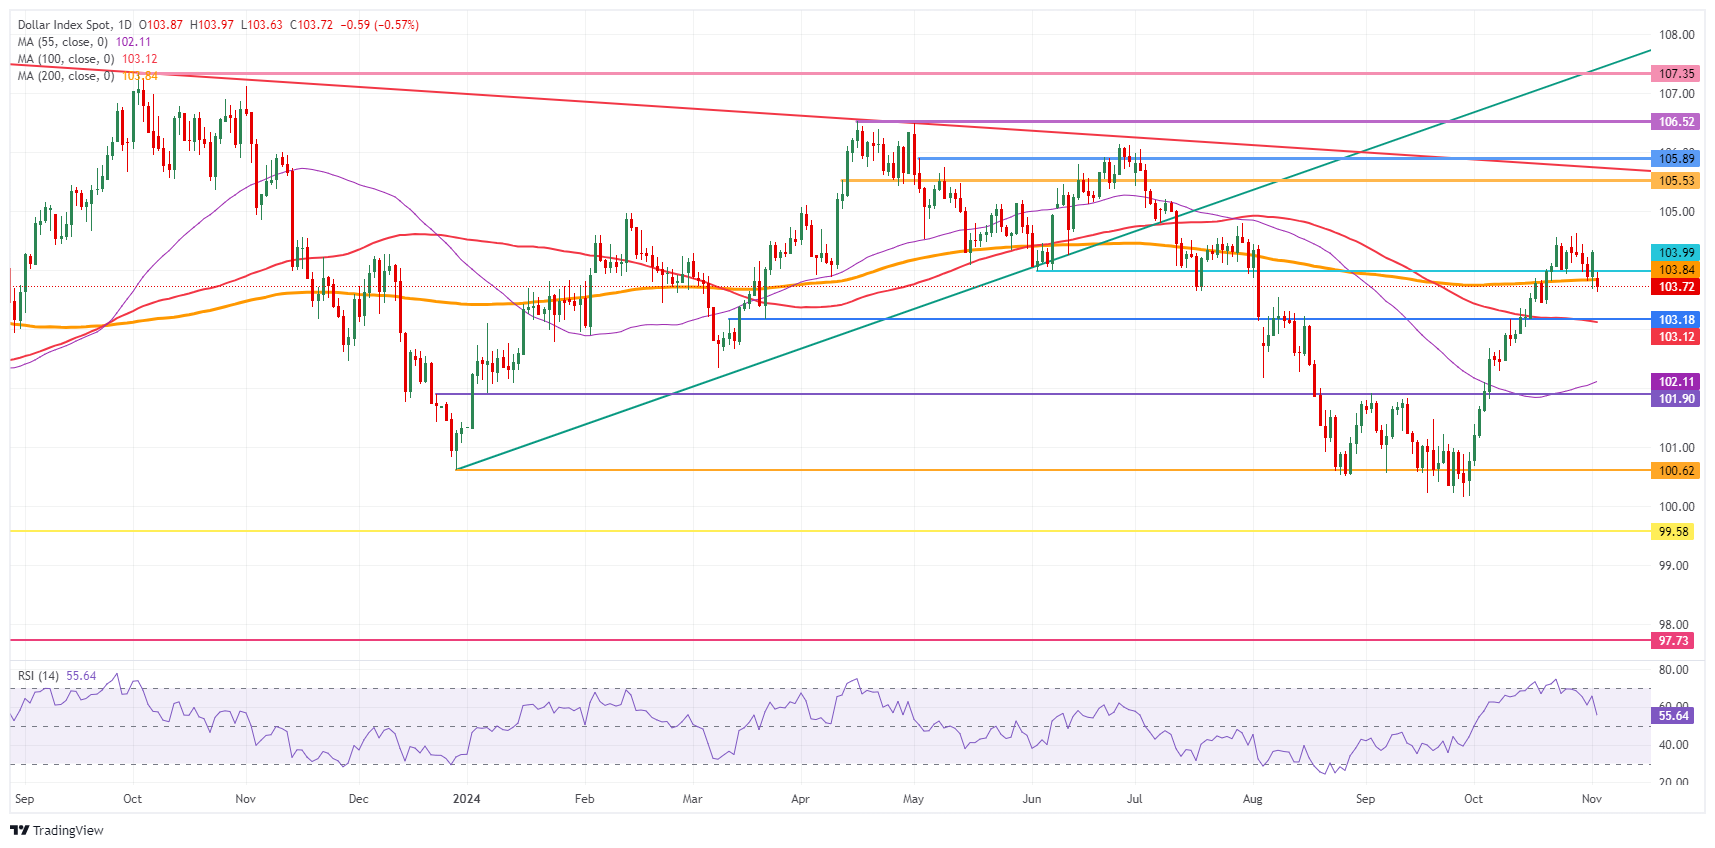
US Dollar Index: Daily Chart
US Dollar FAQs
The US Dollar (USD) is the official currency of the United States of America, and the ‘de facto’ currency of a significant number of other countries where it is found in circulation alongside local notes. It is the most heavily traded currency in the world, accounting for over 88% of all global foreign exchange turnover, or an average of $6.6 trillion in transactions per day, according to data from 2022. Following the second world war, the USD took over from the British Pound as the world’s reserve currency. For most of its history, the US Dollar was backed by Gold, until the Bretton Woods Agreement in 1971 when the Gold Standard went away.
The most important single factor impacting on the value of the US Dollar is monetary policy, which is shaped by the Federal Reserve (Fed). The Fed has two mandates: to achieve price stability (control inflation) and foster full employment. Its primary tool to achieve these two goals is by adjusting interest rates. When prices are rising too quickly and inflation is above the Fed’s 2% target, the Fed will raise rates, which helps the USD value. When inflation falls below 2% or the Unemployment Rate is too high, the Fed may lower interest rates, which weighs on the Greenback.
In extreme situations, the Federal Reserve can also print more Dollars and enact quantitative easing (QE). QE is the process by which the Fed substantially increases the flow of credit in a stuck financial system. It is a non-standard policy measure used when credit has dried up because banks will not lend to each other (out of the fear of counterparty default). It is a last resort when simply lowering interest rates is unlikely to achieve the necessary result. It was the Fed’s weapon of choice to combat the credit crunch that occurred during the Great Financial Crisis in 2008. It involves the Fed printing more Dollars and using them to buy US government bonds predominantly from financial institutions. QE usually leads to a weaker US Dollar.
Quantitative tightening (QT) is the reverse process whereby the Federal Reserve stops buying bonds from financial institutions and does not reinvest the principal from the bonds it holds maturing in new purchases. It is usually positive for the US Dollar.
Recommended Articles


