

US Dollar climbs for third straight day as markets face risks on multiple fronts
- The Greenback has found a firm bidding floor after weeks of being pinned to boards.
- With Fed rate cuts contingent on labor data, expectations for more cuts hang in the balance.
- Geopolitical risks remain a key sticking point for global markets on Wednesday.
The US Dollar (USD) Index (DXY) rose for a third consecutive day as broad-market risk appetite takes a beating. Geopolitical concerns have weighed down investor sentiment this week as conflicts in the Middle East bubble over, and better-than-expected US job data is crimping hopes for follow-up jumbo rate cuts from the Federal Reserve (Fed).
US ADP Employment Change figures printed far higher than markets expected on Wednesday, making it difficult for investors to keep hoping for outsized rate cuts after several Fed officials hit the newswires this week warning that September’s 50 bps rate cut was likely a one-off and not a signal of future policy.
Daily digest market movers
- US Dollar Index (DXY) clears 101.50 as Greenback rally extends on nervous markets.
- The Middle East escalation is threatening to boil over following Iran’s missile attack on Israel on Tuesday.
- Investors are waiting to see how Israel will retaliate against Iran, who were retaliating after Israel launched a ground invasion into Lebanon last week.
- US ADP Employment Change figures came in at 143K for September, clearing the forecast 120K and vaulting over the previous month’s revised 103K.
- Rising employment figures limit market hopes for further outsized Fed rate cuts.
- Investors still look ahead to Friday’s looming Nonfarm Payrolls (NFP) jobs print.
DXY price forecast
Despite a near-term upswing, the US Dollar Index remains fairly tepid overall, with the major currency index still hobbled below previous highs made near 102.00. Greenback traders have grappled with a rough go of things since the US Dollar peaked near 106.50 earlier in 2024. The DXY has recovered over 1.5% from last week’s swing low into the 100.00 handle, but USD flows remain down 4.5% overall from 2024’s peak bid of 106.52.
DXY daily chart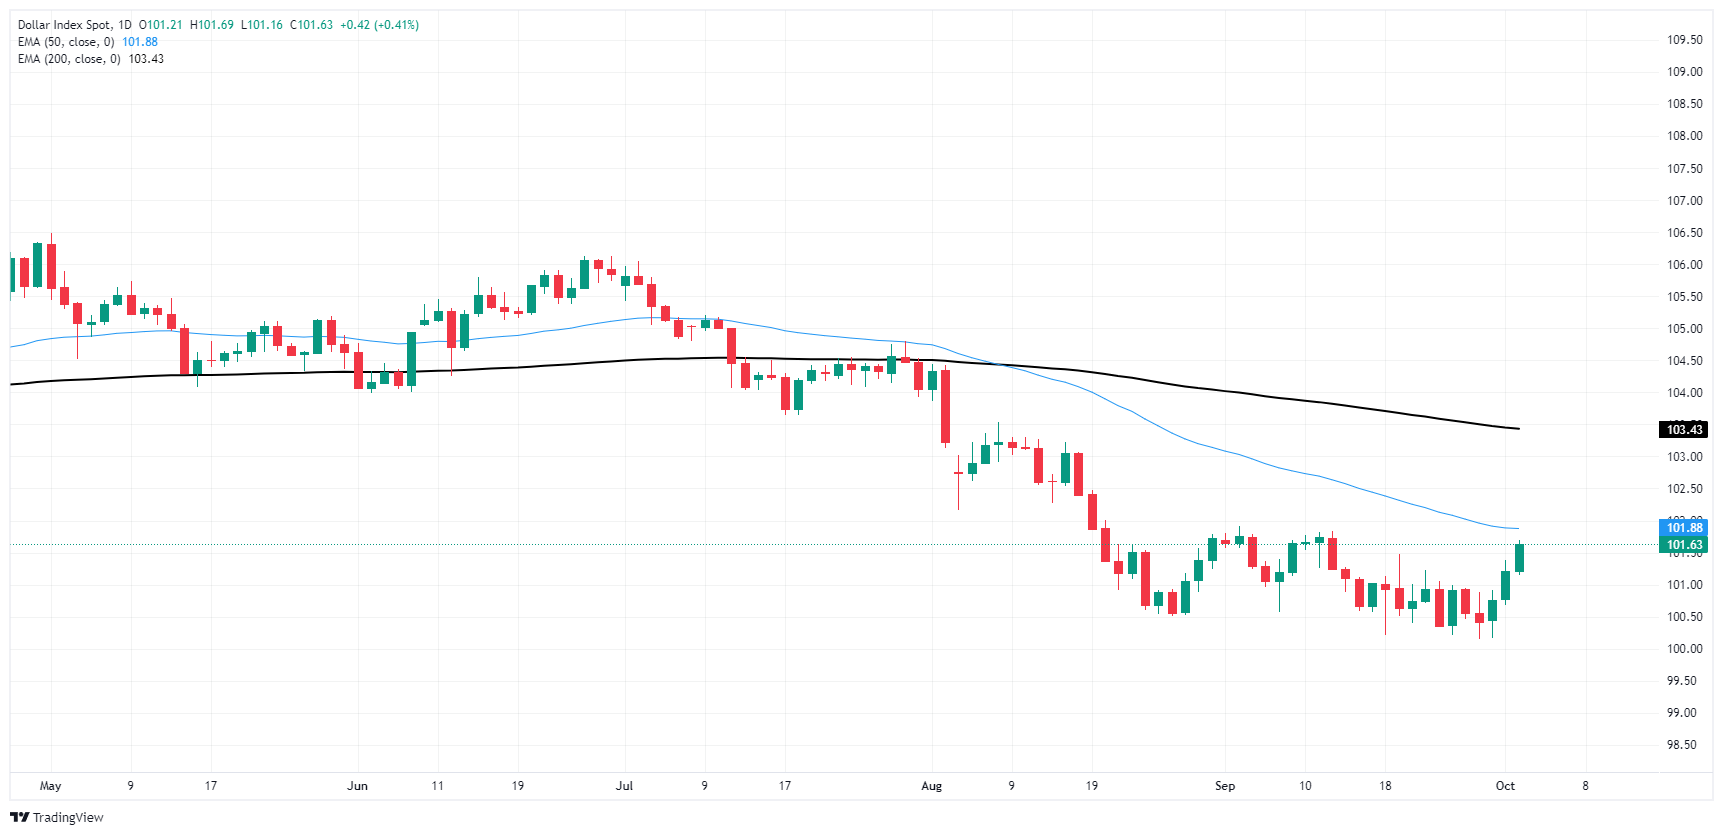
US Dollar FAQs
The US Dollar (USD) is the official currency of the United States of America, and the ‘de facto’ currency of a significant number of other countries where it is found in circulation alongside local notes. It is the most heavily traded currency in the world, accounting for over 88% of all global foreign exchange turnover, or an average of $6.6 trillion in transactions per day, according to data from 2022. Following the second world war, the USD took over from the British Pound as the world’s reserve currency. For most of its history, the US Dollar was backed by Gold, until the Bretton Woods Agreement in 1971 when the Gold Standard went away.
The most important single factor impacting on the value of the US Dollar is monetary policy, which is shaped by the Federal Reserve (Fed). The Fed has two mandates: to achieve price stability (control inflation) and foster full employment. Its primary tool to achieve these two goals is by adjusting interest rates. When prices are rising too quickly and inflation is above the Fed’s 2% target, the Fed will raise rates, which helps the USD value. When inflation falls below 2% or the Unemployment Rate is too high, the Fed may lower interest rates, which weighs on the Greenback.
In extreme situations, the Federal Reserve can also print more Dollars and enact quantitative easing (QE). QE is the process by which the Fed substantially increases the flow of credit in a stuck financial system. It is a non-standard policy measure used when credit has dried up because banks will not lend to each other (out of the fear of counterparty default). It is a last resort when simply lowering interest rates is unlikely to achieve the necessary result. It was the Fed’s weapon of choice to combat the credit crunch that occurred during the Great Financial Crisis in 2008. It involves the Fed printing more Dollars and using them to buy US government bonds predominantly from financial institutions. QE usually leads to a weaker US Dollar.
Quantitative tightening (QT) is the reverse process whereby the Federal Reserve stops buying bonds from financial institutions and does not reinvest the principal from the bonds it holds maturing in new purchases. It is usually positive for the US Dollar.
Recommended Articles


