


US Dollar is off to soft start in Nonfarm Payrolls week
- The US Dollar trades flat at the start of this week with US Nonfarm Payrolls as the main event on Friday.
- The US calendar starts quietly with Chicago PMIs and the Dallas Fed Manufacturing survey.
- The US Dollar Index resides near the 2024 low in search of substantial support.
The US Dollar (USD) trades broadly flat at the start of this week, close to the year-to-date lows registered on Friday, ahead of a busy week that will end with the key Nonfarm Payrolls data. The main theme surrounding the jobs data will be how much the US Federal Reserve (Fed) will cut rates in its November meeting.
On Monday’s economic calendar, the Chicago Purchasing Managers Index (PMI) for September is due to be released, followed by the Dallas Fed Manufacturing Business Index for September. With both indices in contraction territory, it will be interesting to see how they will move before US Federal Reserve Chairman Jerome Powell takes the stage around 17:00 GMT.
Daily digest market movers: What could Powell add?
- Monday will start with already two quite important data releases. The first one is the The Chicago Purchasing Managers Index for September, to be published at 13:45 GMT. The expectation is for a number still in contraction at 46.5, a bit better than the 46.1 in August.
- At 14:30 GMT, the Dallas Fed Manufacturing Business Index for September is foreseen to be released. Expectations are similar to the ones for the Chicago PMI, with analysts anticipating the index to remain in contraction at -4.5 but improving from the previous -9.7.
- Two Fed speakers this Monday to look out for:
- Near 12:50 GMT, Federal Reserve Governor Michelle Bowman delivers a speech about the US economic outlook and monetary policy at the Bankers Association President/CEO Conference in Charleston, South Carolina.
- Around 17:00 GMT, Federal Reserve Chairman Jerome Powell delivers a speech about the US economic outlook at the 66th National Association for Business Economics annual meeting in Nashville, Tennessee.
- Asian equity markets trade mixed, with Japanese stocks sinking over 3%, while Chinese equities are rallying higher with the Shanghai Shenzhen CSI 300 composite index up over 8%.
- The CME Fedwatch Tool shows a 60.4% chance of a 25 basis-point rate cut at the next Fed meeting on November 7, while 39.6% is pricing in another 50-basis-point rate cut.
- The US 10-year benchmark rate trades at 3.77%, looking to test the three-week high at 3.81%
US Dollar Index Technical Analysis: Anything from here is an adventure
The US Dollar Index (DXY) is unable to move away from that fresh yearly low at 100.16. The biggest issue is that there are no technical levels to trade on. Either venturous traders will get in and could push the DXY back higher or they will wait for the next pivotal support sub-100.00 at 99.58.
A reshuffle of resistance levels is needed at the start of this week. With three daily closes below 100.62, this level is now considered a firm resistance. In case Dollar bulls can turn things around, look at 101.90 for the second resistance level on the upside. Just above there, the 55-day Simple Moving Average (SMA) at 102.22 will come in.
Time to make our homework as well for more downside. The fresh low of 2024 is at 100.16, so a test will take place before more downside takes place. Further down, and that means giving up the big 100.00 level, the July 14, 2023, low at 99.58 comes into play.
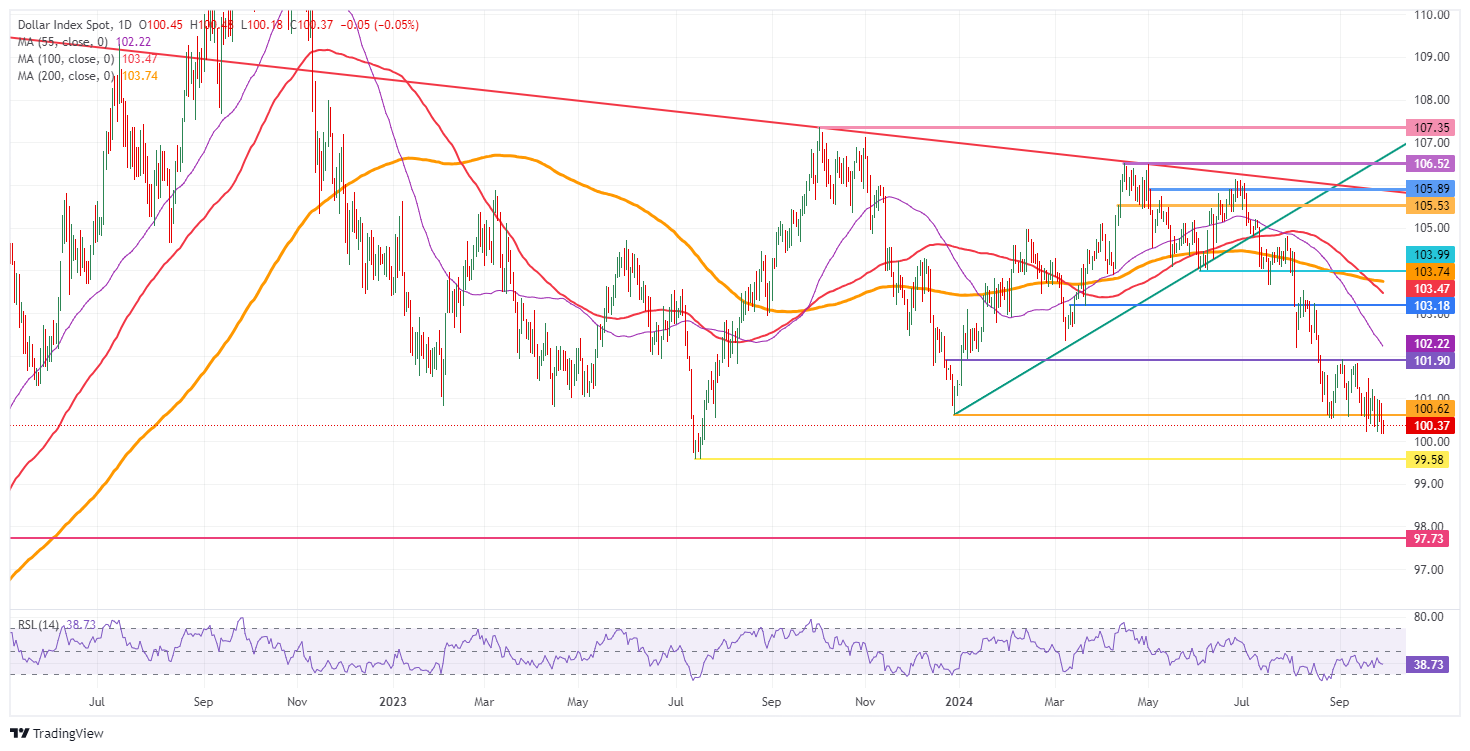
US Dollar Index: Daily Chart
US Dollar FAQs
The US Dollar (USD) is the official currency of the United States of America, and the ‘de facto’ currency of a significant number of other countries where it is found in circulation alongside local notes. It is the most heavily traded currency in the world, accounting for over 88% of all global foreign exchange turnover, or an average of $6.6 trillion in transactions per day, according to data from 2022. Following the second world war, the USD took over from the British Pound as the world’s reserve currency. For most of its history, the US Dollar was backed by Gold, until the Bretton Woods Agreement in 1971 when the Gold Standard went away.
The most important single factor impacting on the value of the US Dollar is monetary policy, which is shaped by the Federal Reserve (Fed). The Fed has two mandates: to achieve price stability (control inflation) and foster full employment. Its primary tool to achieve these two goals is by adjusting interest rates. When prices are rising too quickly and inflation is above the Fed’s 2% target, the Fed will raise rates, which helps the USD value. When inflation falls below 2% or the Unemployment Rate is too high, the Fed may lower interest rates, which weighs on the Greenback.
In extreme situations, the Federal Reserve can also print more Dollars and enact quantitative easing (QE). QE is the process by which the Fed substantially increases the flow of credit in a stuck financial system. It is a non-standard policy measure used when credit has dried up because banks will not lend to each other (out of the fear of counterparty default). It is a last resort when simply lowering interest rates is unlikely to achieve the necessary result. It was the Fed’s weapon of choice to combat the credit crunch that occurred during the Great Financial Crisis in 2008. It involves the Fed printing more Dollars and using them to buy US government bonds predominantly from financial institutions. QE usually leads to a weaker US Dollar.
Quantitative tightening (QT) is the reverse process whereby the Federal Reserve stops buying bonds from financial institutions and does not reinvest the principal from the bonds it holds maturing in new purchases. It is usually positive for the US Dollar.
Recommended Articles


