US equities mix on Friday, S&P 500 threatens a pullback

Source Fxstreet
  • S&P 500, NASDAQ Composite end six-day record streaks.
  • Despite weaker Friday, US indexes closed in the green for a third straight week.
  • US Fed on the docket for next week.

US equities closed mixed on Friday to cap off a week of stunning record closes. Over-eager markets that have been leaning into rate cut bets in recent weeks second-guessed US economic conditions after US Personal Consumption Expenditure (PCE) Price Index figures showed cooling inflation, but consumer spending and housing activity hinted at a US economy that is too robust to allow for a rapid approach on Federal Reserve (Fed) rate cuts.

Money markets repriced odds of a first rate trim from the Fed to the Federal Open Market Committee’s (FOMC) meeting in May, with bets of a March rate cut down to 47% according to the CME’s FedWatch Tool.

US Core YoY PCE Price Index figures for December printed at 2.9% on Friday, below the forecast 3.0% and slipping back from the previous period’s 3.2%. Markets initially rose on reaction to the good news that cooling inflation might lead to faster, sooner rate cuts from the Fed, but an uptick in Personal Spending and Pending Home Sales put a damper on rate hopes.

US Personal Spending rose 0.7% in December compared to the 0.4% forecast and 0.4% previous (revised from 0.2%), and Pending Home Sales jumped 8.3% in December compared to the forecast 1.5% and -0.3% previous (revised from 0.0%).

Revenue forecasts on Wall Street missed expectations for major tech stocks including Intel and chipmaker tool manufacturer KLA Corp, causing equities to rethink recent bullish momentum on tech hopes alongside recent declines in tech darlings Tesla and Apple.

The Dow Jones Industrial Average (DJIA) gained 60 points to close up 0.16% at $38,109.43 while the Standard & Poor’s 500 (S&P) Major equity index closed down 0.07%, shedding a little over 3 points and ending Friday at $4,890.97.

The NASDAQ Composite declined on tech stock hesitancy, losing 55 points and closing down by a third of a percent at $15,455.36.

S&P Technical Outlook

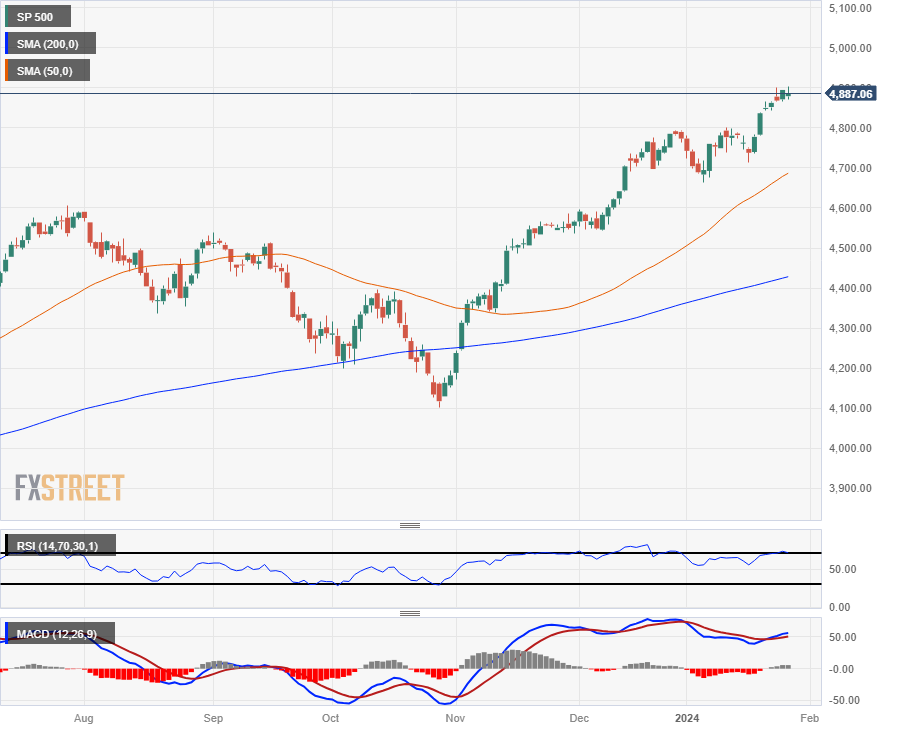
The S&P closed in the green for a third straight week, chalking in 12 winning weeks out of the last 13, and the major index is up nearly 20% from the last significant swing low into $4,102.02 in October.

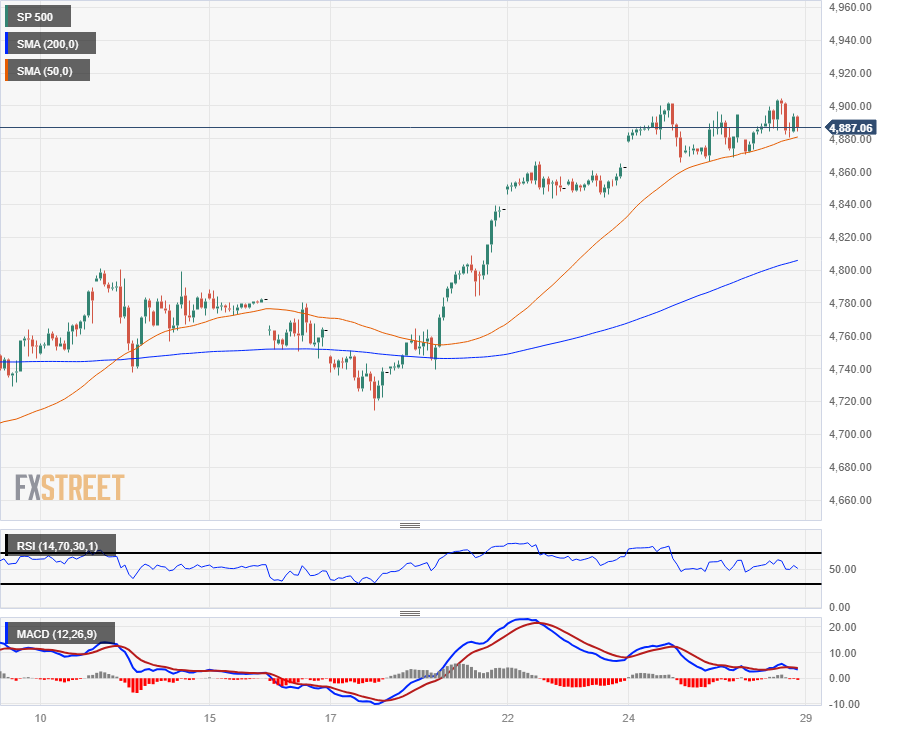
The S&P 500 is trading well above the 200-day Simple Moving Average (SMA) near $4,425.00, and is in play near the $4,900.00 as investors eye another push towards the $5,000.00 major handle nearby.

S&P 500 Hourly Chart
S&P 500 Daily Chart
 

Disclaimer: For information purposes only. Past performance is not indicative of future results.
placeholder
2025 Black Friday is coming! Which stocks may see volatility?Coming on the day right after Thanksgiving in the United States, Back Friday marks the start of the holiday shopping season. Sales data from this shopping frenzy day reflects investor confidence and consumer trends. The National Retail Federation (NRF) predicts that holiday season (Nov and Dec) retail sales in 2025 will likely exceed $1 trillion for the very first time, which represents a year-over-year increase of 3.7 to 4.2 percent. Historic data from the past decade show that the retail sector has generally outperformed the S&P 500 during the weeks before and after Black Friday. The following retailing companies are expected to be big winners:
Author  Insights
Nov 24, Mon
Coming on the day right after Thanksgiving in the United States, Back Friday marks the start of the holiday shopping season. Sales data from this shopping frenzy day reflects investor confidence and consumer trends. The National Retail Federation (NRF) predicts that holiday season (Nov and Dec) retail sales in 2025 will likely exceed $1 trillion for the very first time, which represents a year-over-year increase of 3.7 to 4.2 percent. Historic data from the past decade show that the retail sector has generally outperformed the S&P 500 during the weeks before and after Black Friday. The following retailing companies are expected to be big winners:
placeholder
Bitcoin Bleeds to $86K, But This Key Indicator Screams "The Top Isn't In"Bitcoin’s adjusted Spent Output Profit Ratio (aSOPR) has spent nearly two years coiling below the extremes seen at past bull-market peaks, even as BTC trades around $86,300 and down 9% on the week — a setup that leaves open the possibility that this cycle’s true top may still lie ahead.
Author  Mitrade
Nov 25, Tue
Bitcoin’s adjusted Spent Output Profit Ratio (aSOPR) has spent nearly two years coiling below the extremes seen at past bull-market peaks, even as BTC trades around $86,300 and down 9% on the week — a setup that leaves open the possibility that this cycle’s true top may still lie ahead.
placeholder
Bitcoin Price Rebound Gains Traction with $90K Break in SightBitcoin is trading above $87,000 and its 100-hour SMA after rebounding from $83,500, with a bearish trend line at $88,200 and resistance at $89,000–$90,000 now in focus as BTC either breaks higher toward $91,750–$94,000 or slips back toward $86,700, $85,000 and lower supports.
Author  Mitrade
Yesterday 02: 58
Bitcoin is trading above $87,000 and its 100-hour SMA after rebounding from $83,500, with a bearish trend line at $88,200 and resistance at $89,000–$90,000 now in focus as BTC either breaks higher toward $91,750–$94,000 or slips back toward $86,700, $85,000 and lower supports.
placeholder
Bitcoin Targets $89K Breakout as S&P 500 Nears ATH on Fed Rate Cut HopesBitcoin price action shows signs of a potential short squeeze as it hovers near $88,000, with analysts watching liquidity dynamics that could push it toward $89,000 or retrace to $85,000.
Author  Mitrade
5 hours ago
Bitcoin price action shows signs of a potential short squeeze as it hovers near $88,000, with analysts watching liquidity dynamics that could push it toward $89,000 or retrace to $85,000.
placeholder
Ethereum Reclaims $3K Handle—Is a Breakout Imminent?Ethereum has jumped back above $3,000 and reclaimed key Fib levels, with a bullish trend line at $2,880 and strong MACD/RSI readings putting a breakout above $3,120–$3,165 — and a possible run toward $3,320–$3,350 — on the table, as long as support around $2,980–$2,920 holds.
Author  Mitrade
5 hours ago
Ethereum has jumped back above $3,000 and reclaimed key Fib levels, with a bullish trend line at $2,880 and strong MACD/RSI readings putting a breakout above $3,120–$3,165 — and a possible run toward $3,320–$3,350 — on the table, as long as support around $2,980–$2,920 holds.
goTop
quote