


Dow Jones Industrial Average squeezes higher on Friday
- The Dow Jones is inching back into record highs on Friday.
- The index continues to find play above 42,000 in the post-Fed glut.
- The Dow Jones stock index rose up to 100 points, or 0.25%, during Friday trading.
The Dow Jones Industrial Average (DJIA) edged back into the top end during the Friday market session, keeping bids north of 42,000 and sticking close to this week’s all-time record peaks. Equities pivoted firmly into the bullish side after the Federal Reserve (Fed) cut interest rates for the first time in over four years, delivering an outsized 50 bps rate cut.
Federal Reserve (Fed) Chair Jerome Powell delivered a jumbo 50 bps rate cut this week, pivoting the narrative as a “re-calibration of policy” to shore up the US labor market rather than an outright snap reaction to decaying economic indicators. Markets, for their part, scooped up the Fed Chair’s bid full-parcel, bolstering equities across the board in a rate-cut splurge and sending the US Dollar Index (DXY) to a 14-month low.
With the Fed’s first rate cut in over four years finally out of the way, investors are now ready to pivot to the next immediate task: betting on whether the Fed’s November rate cut will be a 25 bps follow-up or another 50 bps slash. According to the CME’s FedWatch Tool, rate traders have fully priced in another rate cut from the Fed on November 7, with bets evenly split between 25 and 50 bps. Rate markets are so confident the Fed will deliver a follow-up rate cut in a little over six weeks there is currently a 0% chance priced in of the Fed holding rates steady in November.
Dow Jones news
A little under half of the Dow Jones equity index is underwater on Friday, with losses being led by Intel (INTC) which has backslid -3.5% and tumbled below $20.50 per share. Intel recently announced multiple plans to spin the vessel back keel-side down, including axing around 10% of their global workforce, spinning off their foundry business into an independent subsidiary, and inking a fresh deal with Amazon to produce exclusive AI-based chipsets for Amazon Web Services. Despite all of the planned pivots, investors are still balking at the silicon company’s expected $25 to $27 billion in capital expenditures over the next year.
The Dow Chemical Company (DOW) is also chasing the bottom of the barrel on Friday, despite a recent announcement that the manufacturing company was tapped to receive $100 million in subsidy funding from the Department of Energy to establish or expand US-based battery manufacturing.
Dow Jones price forecast
Despite an absolutely stellar performance on the charts recently, bidding pressure is beginning to show signs of exhaustion, with the Dow Jones struggling to continue chalking in subsequent record highs with little to no pullback. The major equity index rose nearly 5.5% from the last swing low into the 40,000 major price handle, and price action is set to dig into the 42,000 level for the time being.
Dow Jones daily chart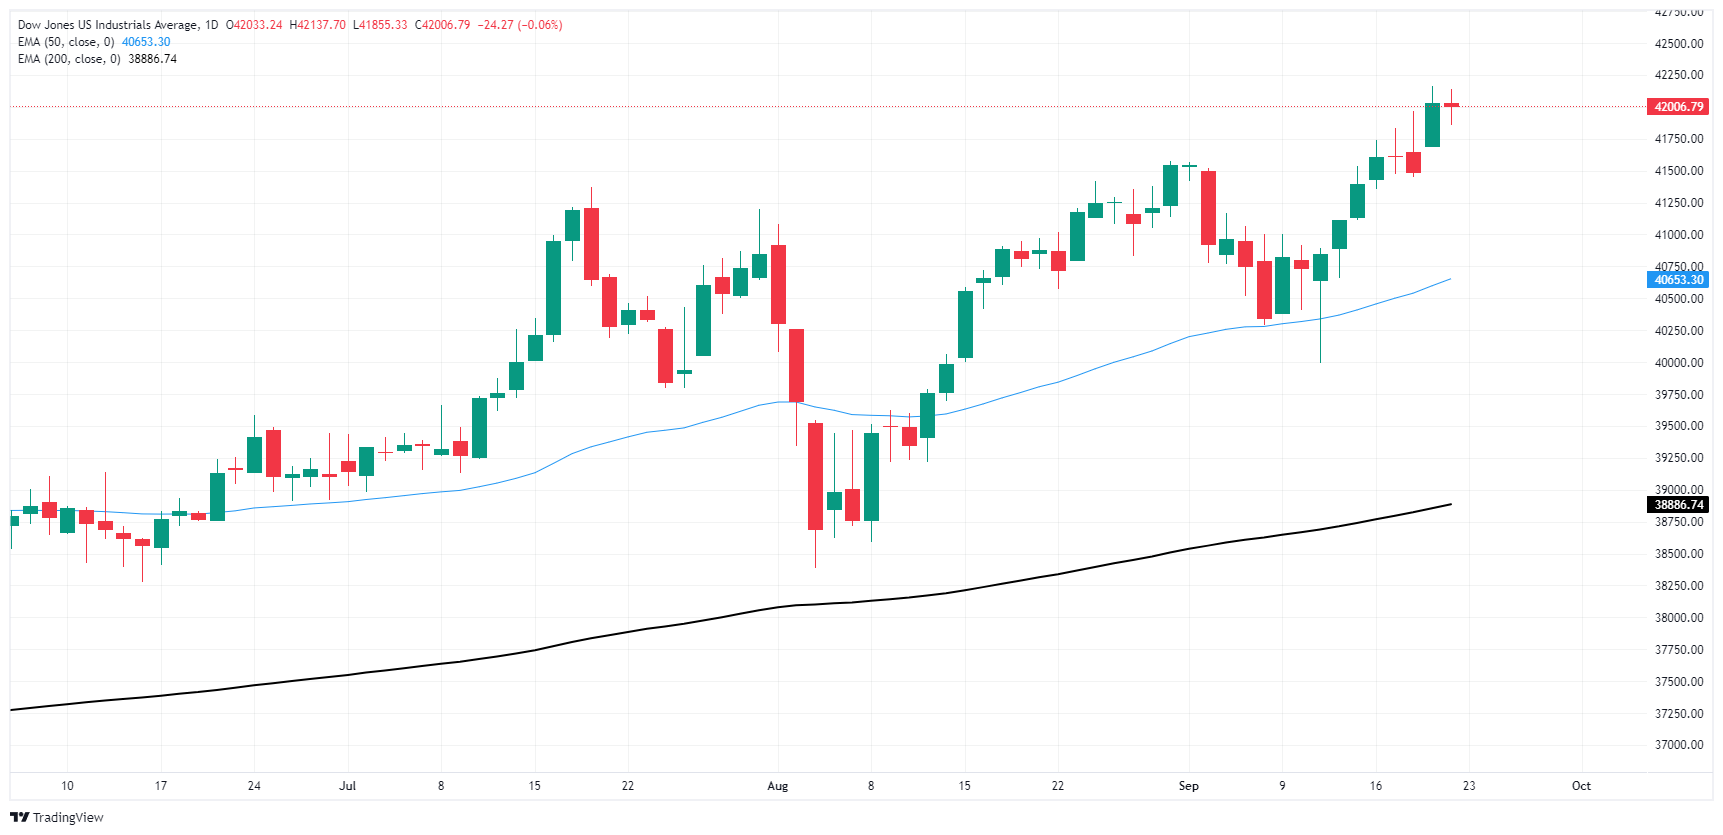
Dow Jones FAQs
The Dow Jones Industrial Average, one of the oldest stock market indices in the world, is compiled of the 30 most traded stocks in the US. The index is price-weighted rather than weighted by capitalization. It is calculated by summing the prices of the constituent stocks and dividing them by a factor, currently 0.152. The index was founded by Charles Dow, who also founded the Wall Street Journal. In later years it has been criticized for not being broadly representative enough because it only tracks 30 conglomerates, unlike broader indices such as the S&P 500.
Many different factors drive the Dow Jones Industrial Average (DJIA). The aggregate performance of the component companies revealed in quarterly company earnings reports is the main one. US and global macroeconomic data also contributes as it impacts on investor sentiment. The level of interest rates, set by the Federal Reserve (Fed), also influences the DJIA as it affects the cost of credit, on which many corporations are heavily reliant. Therefore, inflation can be a major driver as well as other metrics which impact the Fed decisions.
Dow Theory is a method for identifying the primary trend of the stock market developed by Charles Dow. A key step is to compare the direction of the Dow Jones Industrial Average (DJIA) and the Dow Jones Transportation Average (DJTA) and only follow trends where both are moving in the same direction. Volume is a confirmatory criteria. The theory uses elements of peak and trough analysis. Dow’s theory posits three trend phases: accumulation, when smart money starts buying or selling; public participation, when the wider public joins in; and distribution, when the smart money exits.
There are a number of ways to trade the DJIA. One is to use ETFs which allow investors to trade the DJIA as a single security, rather than having to buy shares in all 30 constituent companies. A leading example is the SPDR Dow Jones Industrial Average ETF (DIA). DJIA futures contracts enable traders to speculate on the future value of the index and Options provide the right, but not the obligation, to buy or sell the index at a predetermined price in the future. Mutual funds enable investors to buy a share of a diversified portfolio of DJIA stocks thus providing exposure to the overall index.
Recommended Articles


