

US Dollar starts road to recovery with RBA supporting Fed’s stance
- The US Dollar is recovering from Monday’s meltdown and advances against the Japanese Yen.
- Overnight, the RBA confirmed the Fed’s stance that a few data points are not enough to change the narrative.
- The US Dollar index flirts with a break above 103.00 and could turn this week’s performance into positive territory.
The US Dollar (USD) recovers firmly on Tuesday, with the Greenback sprinting higher against the Japanese Yen (JPY). The turnaround was already triggered in the US trading session on Monday when President of the Federal Reserve Bank of Chicago, Austan Goolsbee, tried to soothe markets by saying that a few easing data points are not enough to open the debate on a recession. Royal Bank of Australia (RBA) president Michelle Bullock joined that thesis and even added that another rate hike is not off the table, while the RBA decided to keep its interest rate unchanged during its August meeting earlier on the day.
On the economic front, the main point for this week is already out of the way. The Institute for Supply Management (ISM) data was released on Monday and helped spark the turnaround in the Dollar’s appeal as the ISM Service Purchasing Managers Index (PMI) expanded at a faster pace than expected. The main theme on Tuesday is the US Trade Balance data for June. Nothing really market moving expected from this.
Daily digest market movers: Back to normal programming
- Markets are recovering from Monday’s route, and equities move higher across the board. The Greenback is outpacing the Japanese Yen by over 1% in the European trading session.
- US Vice President Kamala Harris has been formally nominated as the Democratic candidate for the upcoming Presidential elections in November.
- At 12:30 GMT, the US Goods and Trade Balance data for June will be released:
- Goods and Services Trade Balance deficit seen heading from $75.1 billion to a smaller $72.4 billion.
- Goods Trade Balance deficit was at $96.8 billion in May, though no forecast is available for June.
- At 14:00 GMT, the TechnoMetrica Institute of Policy and Politics (TIPP) will release its monthly Economic Optimism Survey for August. The previous reading was at 44.2, with an increase to 45 forecasted for August.
- The US Treasury is heading to markets to sell 52-week bills and allocate 3-year notes at sharply lower rates than previously.
- Equity markets are jumping higher, with the Japanese Nikkei and Topix closing Tuesday with 10% gains each. Europe is trading solidly in positive territory. In theUS futures market, the Nasdaq leads the recovery, rising by nearly 2% in the day.
- The CME Fedwatch Tool shows a 73.5% chance of a 50 basis points (bps) interest rate cut by the Federal Reserve in September. Another 25 bps cut is expected in November by 54.5%, while a 29.7% chance for a 50 bps cut and 15.8% for no cut at all are being pencilled in for that meeting.
- The US 10-year benchmark rate trades at a new 52-week low at 3.86%, shooting higher as investors flee away from bonds and back into equities.
US Dollar Index Technical Analysis: Make way for the King!
The US Dollar Index (DXY) is recovering, and it could turn into a very profitable week for the Greenback. Many investors and experienced traders will have used Monday’s route to do some bargain hunting and used the momentum to go against the tide as a recession in the US is clearly not in focus. With a very light US data calendar ahead, the risk for any underperforming data looks limited, which means that the DXY has room to rally back to July levels.
The three-tiered recovery is already in play, with the first up at 103.18, a level held on Friday though snapped on Monday in the Asian hours. Once the DXY closes above that level, next up is 104.00, which was the support from June. If the DXY can make its way back above that level, the 200-day Simple Moving Average (SMA) at 104.22 is the next resistance level to look out for.
On the downside, the oversold Relative Strength Index (RSI) indicator should prevent the DXY from making more hefty losses. Support nearby is the March 8 low at 102.35. Once through there, pressure will start to build on 102.00 as a big psychological figure before testing 101.90, which was a pivotal level in December 2023 and January 2024.
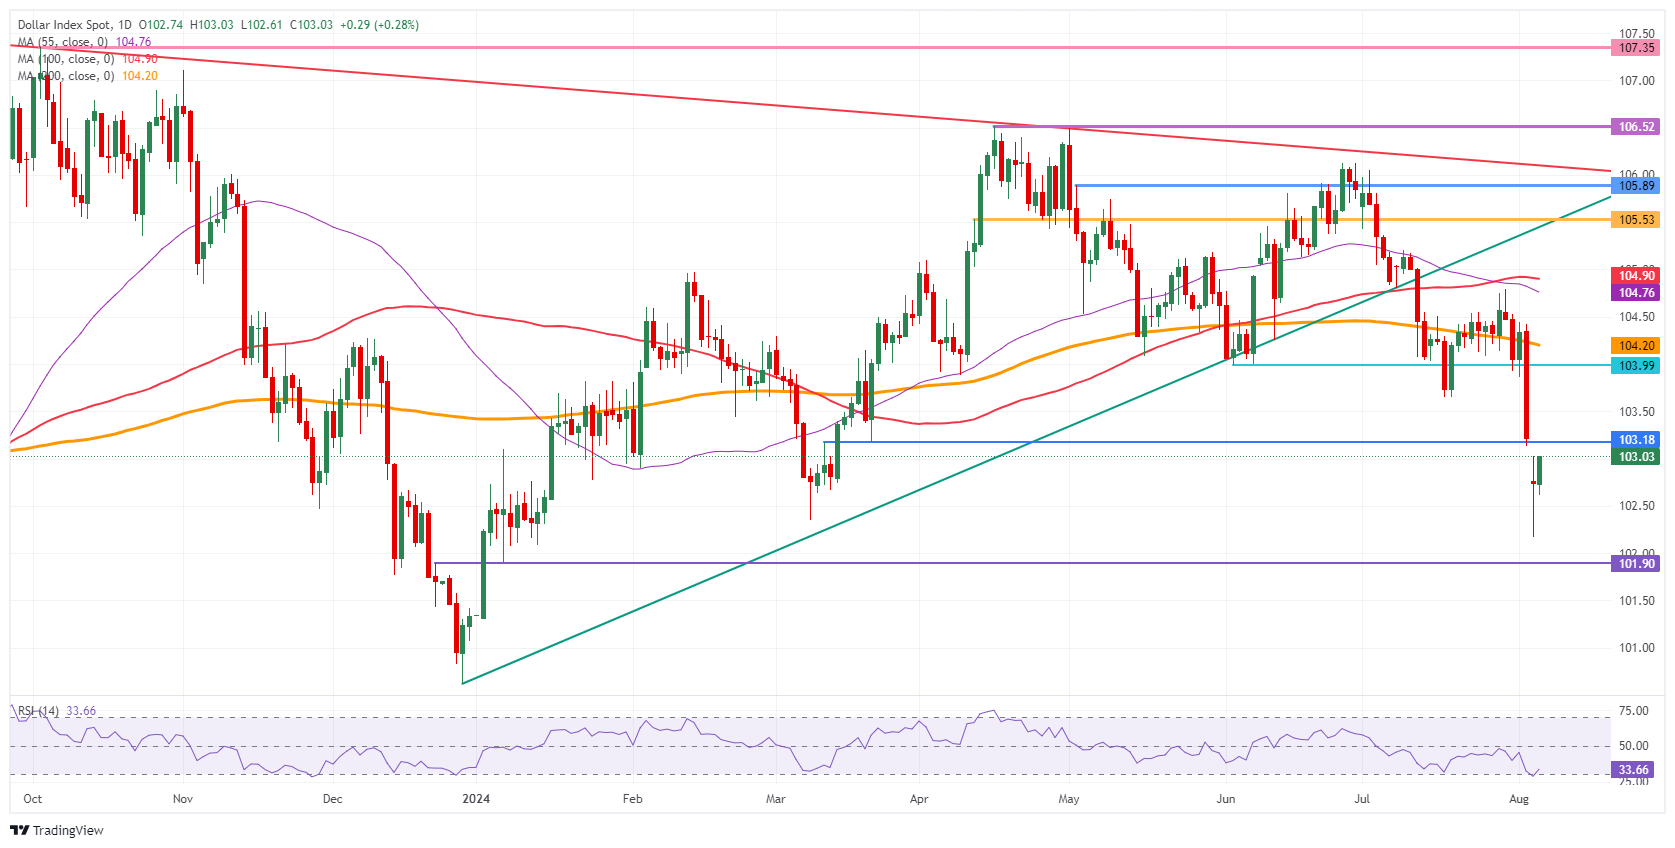
US Dollar Index: Daily Chart
US Dollar FAQs
The US Dollar (USD) is the official currency of the United States of America, and the ‘de facto’ currency of a significant number of other countries where it is found in circulation alongside local notes. It is the most heavily traded currency in the world, accounting for over 88% of all global foreign exchange turnover, or an average of $6.6 trillion in transactions per day, according to data from 2022. Following the second world war, the USD took over from the British Pound as the world’s reserve currency. For most of its history, the US Dollar was backed by Gold, until the Bretton Woods Agreement in 1971 when the Gold Standard went away.
The most important single factor impacting on the value of the US Dollar is monetary policy, which is shaped by the Federal Reserve (Fed). The Fed has two mandates: to achieve price stability (control inflation) and foster full employment. Its primary tool to achieve these two goals is by adjusting interest rates. When prices are rising too quickly and inflation is above the Fed’s 2% target, the Fed will raise rates, which helps the USD value. When inflation falls below 2% or the Unemployment Rate is too high, the Fed may lower interest rates, which weighs on the Greenback.
In extreme situations, the Federal Reserve can also print more Dollars and enact quantitative easing (QE). QE is the process by which the Fed substantially increases the flow of credit in a stuck financial system. It is a non-standard policy measure used when credit has dried up because banks will not lend to each other (out of the fear of counterparty default). It is a last resort when simply lowering interest rates is unlikely to achieve the necessary result. It was the Fed’s weapon of choice to combat the credit crunch that occurred during the Great Financial Crisis in 2008. It involves the Fed printing more Dollars and using them to buy US government bonds predominantly from financial institutions. QE usually leads to a weaker US Dollar.
Quantitative tightening (QT) is the reverse process whereby the Federal Reserve stops buying bonds from financial institutions and does not reinvest the principal from the bonds it holds maturing in new purchases. It is usually positive for the US Dollar.
Recommended Articles


