

Dow Jones Industrial Average surges in Thursday rebound after US GDP upswing
- The Dow Jones rallied to recover recently-lost ground on Thursday.
- Equities are broadly higher as investors focus on good-bad news.
- Rate markets second-guess their stance on a Fed rate cut, but only slightly.
The Dow Jones Industrial Average (DJIA) rallied on Thursday after headline US Gross Domestic Product (GDP) figures lurched higher, crimping rate market odds of a September rate cut. However, a mixed outlook in the underlying GDP figures and a sharp contraction in US Durable Goods Orders has overall risk appetite pinned firmly in the high end as investors continue to hinge entirely on softening data to help bully the Federal Reserve (Fed) into a fresh rate-cutting cycle.
Annualized quarterly GDP surged to 2.8% in the second quarter, well above the forecast 2.0% and piling onto the previous quarter’s 1.4%. The firm upswing in US headline GDP growth over the first half of 2024 made rate traders blink, and rate traders have backed away from sky-high hopes of a first rate cut in September. Despite the easing in rate cut expectations, odds of an upcoming rate slash in the third quarter are still affixed firmly on the high side: according to the CME’s FedWatch Tool, rate markets briefly priced in only 85% odds of at least a quarter-point rate cut on September 18 before investors took a second look at US data figures and re-pinned rate cut odds at 100%.
Looking at the underlying data that made up the US’ Thursday data dump, there was more to US GDP figures in the second quarter than meets the eye. A wide uptick in government spending at the federal and state levels made up a large chunk of the gains in Q2 GDP growth, and a significant amount of spending counted as growth was large gains in shelter spending and healthcare costs, two categories that US consumers have no choice but to meet price increases in with little middle ground for spending negotiations. Between government spending, rents, and medical costs, the three categories accounted for roughly 80% in the gains in GDP growth.
US Durable Goods Orders contracted sharply in June, printing a -6.6% decline compared to the forecast 0.3% and the previous month’s 0.1% uptick. It is the worst Durable Goods Orders report since February, and every Durable Goods Orders print has been revised lower since April 2023’s report. 2024’s cumulative Durable Goods Orders are down over ten percent year-to-date, and further declines are expected as downward revisions continue.
Markets will now be pivoting to Friday’s Personal Consumption Expenditure Price Index (PCE) inflation to help put the nail in the coffin for the week’s data schedule. Investors are broadly hoping for another downtick in US PCE inflation, with median market forecasts calling for a 2.5% YoY print in core PCE inflation compared to the previous print of 2.6%.
Economic Indicator
Gross Domestic Product Annualized
The real Gross Domestic Product (GDP) Annualized, released quarterly by the US Bureau of Economic Analysis, measures the value of the final goods and services produced in the United States in a given period of time. Changes in GDP are the most popular indicator of the nation’s overall economic health. The data is expressed at an annualized rate, which means that the rate has been adjusted to reflect the amount GDP would have changed over a year’s time, had it continued to grow at that specific rate. Generally speaking, a high reading is seen as bullish for the US Dollar (USD), while a low reading is seen as bearish.
Read more.Last release: Thu Jul 25, 2024 12:30 (Prel)
Frequency: Quarterly
Actual: 2.8%
Consensus: 2%
Previous: 1.4%
Source: US Bureau of Economic Analysis
The US Bureau of Economic Analysis (BEA) releases the Gross Domestic Product (GDP) growth on an annualized basis for each quarter. After publishing the first estimate, the BEA revises the data two more times, with the third release representing the final reading. Usually, the first estimate is the main market mover and a positive surprise is seen as a USD-positive development while a disappointing print is likely to weigh on the greenback. Market participants usually dismiss the second and third releases as they are generally not significant enough to meaningfully alter the growth picture.
Dow Jones news
The Dow Jones climbed over 350 points on Thursday, gaining over nine-tenths of one percent and clambering back over the 40,000.00 major price handle as stocks pile back into risk-on bets after the previous day’s sharp decline that saw the Dow Jones shed around 500 points in a single day.
Over two-thirds of the Dow Jones index is in the green on Thursday, led by investors piling back into tech darlings like International Business Machines Corp. (IBM) and Salesforce Inc. (CRM). IBM rallied after reporting higher-than-expected AI bookings as major tech companies continue to sell shovels and pickaxes in the AI gold rush. IBM is up nearly 6% on Thursday, trading into $195.00 dollars per share. CRM rose nearly 4.5% to cross over $260.00 per share as the AI trade continues to capture investor attention.
Dow Jones technical outlook
The Dow Jones rallied in a bid to recapture lost ground on Thursday, adding back over 350 points on the day and recovering a large chunk of Wednesday’s 500-point decline. The DJIA is back over the 40,000.00 mega handle, testing the waters near 40,200.00.
Despite the day’s recovery, the Dow Jones is still at the low side of a deep pullback from record highs set last week at 41,371.38. Long-tern, the DJIA is trading just fine, chewing through chart paper well above the 200-day Exponential Moving Average (EMA) at 37,950.00.
Dow Jones five-minute chart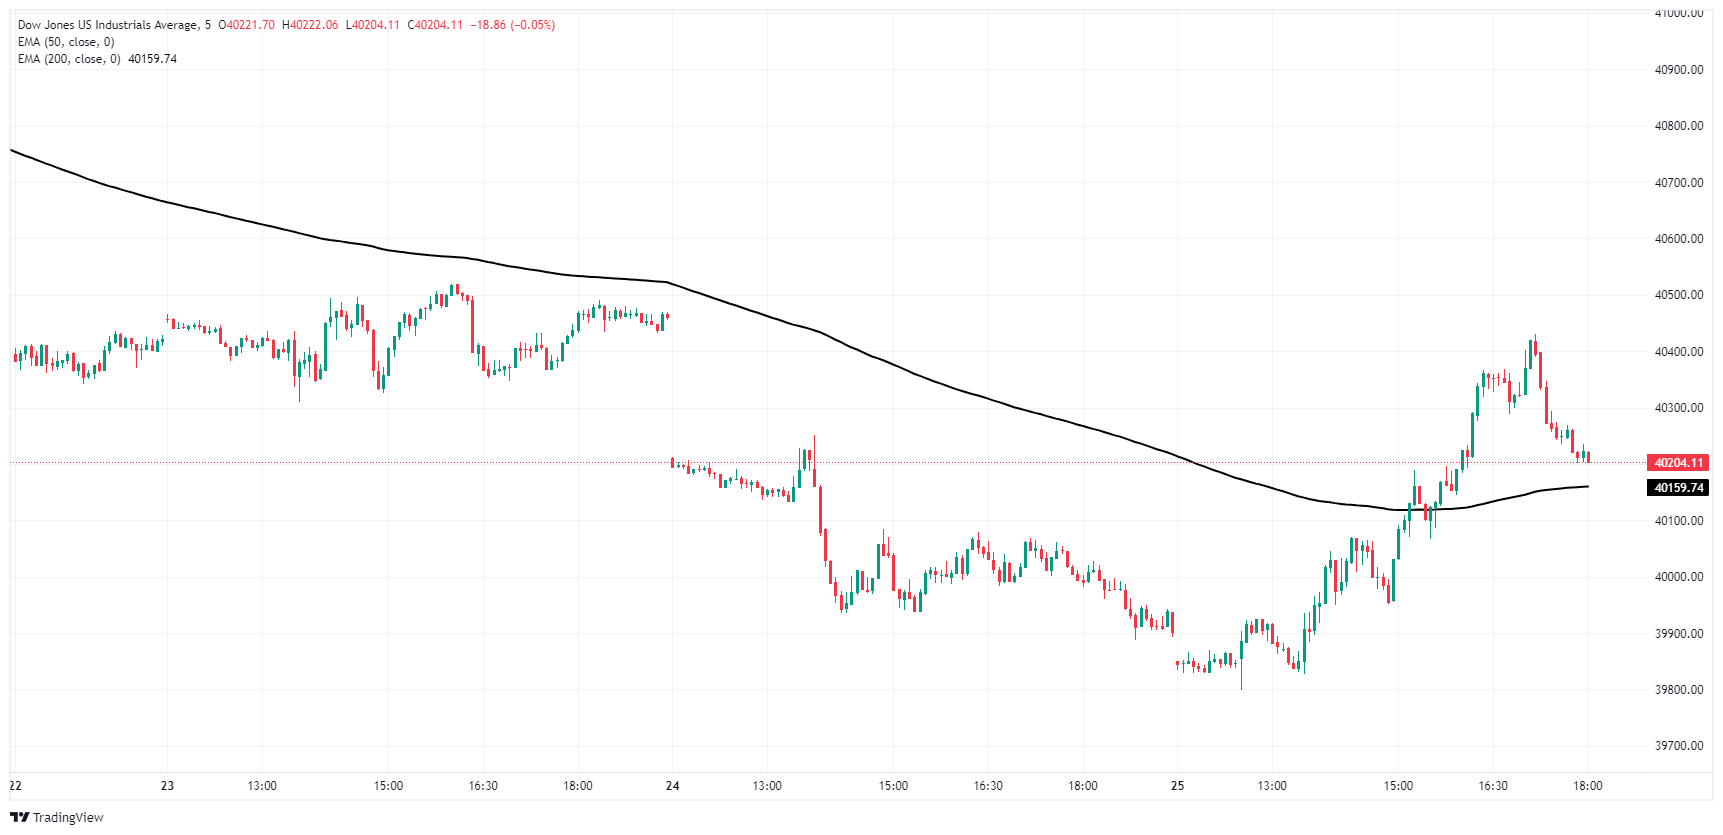
Dow Jones daily chart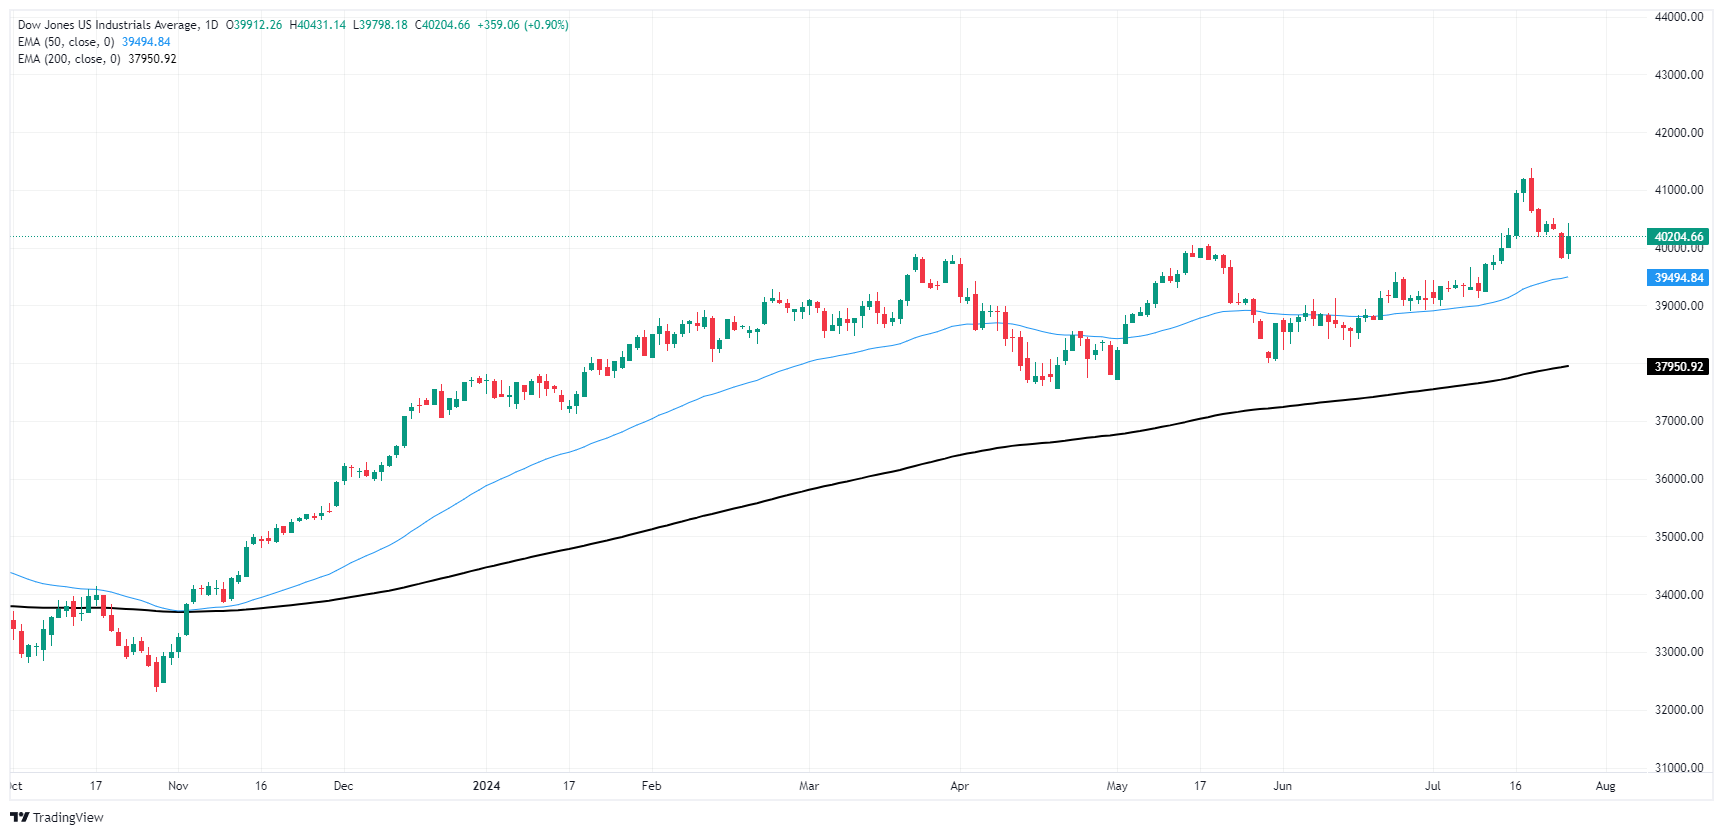
Dow Jones FAQs
The Dow Jones Industrial Average, one of the oldest stock market indices in the world, is compiled of the 30 most traded stocks in the US. The index is price-weighted rather than weighted by capitalization. It is calculated by summing the prices of the constituent stocks and dividing them by a factor, currently 0.152. The index was founded by Charles Dow, who also founded the Wall Street Journal. In later years it has been criticized for not being broadly representative enough because it only tracks 30 conglomerates, unlike broader indices such as the S&P 500.
Many different factors drive the Dow Jones Industrial Average (DJIA). The aggregate performance of the component companies revealed in quarterly company earnings reports is the main one. US and global macroeconomic data also contributes as it impacts on investor sentiment. The level of interest rates, set by the Federal Reserve (Fed), also influences the DJIA as it affects the cost of credit, on which many corporations are heavily reliant. Therefore, inflation can be a major driver as well as other metrics which impact the Fed decisions.
Dow Theory is a method for identifying the primary trend of the stock market developed by Charles Dow. A key step is to compare the direction of the Dow Jones Industrial Average (DJIA) and the Dow Jones Transportation Average (DJTA) and only follow trends where both are moving in the same direction. Volume is a confirmatory criteria. The theory uses elements of peak and trough analysis. Dow’s theory posits three trend phases: accumulation, when smart money starts buying or selling; public participation, when the wider public joins in; and distribution, when the smart money exits.
There are a number of ways to trade the DJIA. One is to use ETFs which allow investors to trade the DJIA as a single security, rather than having to buy shares in all 30 constituent companies. A leading example is the SPDR Dow Jones Industrial Average ETF (DIA). DJIA futures contracts enable traders to speculate on the future value of the index and Options provide the right, but not the obligation, to buy or sell the index at a predetermined price in the future. Mutual funds enable investors to buy a share of a diversified portfolio of DJIA stocks thus providing exposure to the overall index.
Recommended Articles


