

Dow Jones Industrial Average chalks in another record high before easing back on Thursday
- Dow Jones rose into a fifth consecutive all-time high before receding on Thursday.
- Equities are paring back after a heady rally on rate cut hopes.
- September rate cut is fully priced in, Fed hold at the end of July expected.
The Dow Jones Industrial Average (DJIA) rallied into yet another record high on Thursday before turning lower and following the broader market into a soft pullback that dragged intraday prices back into the midweek range. The Dow Jones is trading firmly above the 40,000.00 major price handle after getting buoyed into all-time highs by investor expectations of a September rate cut getting pinned to the ceiling.
According to the CME’s FedWatch Tool, rate markets are pricing in over 98% odds of at least a quarter-point rate trim from the Federal Reserve (Fed) in September. Some particularly adventurous rate traders are pricing in a 5% chance of a first cut in July, but odds remain low at 5%.
Thursday’s Initial Jobless Claims print helped to keep rate cut hopes bolstered after the number of new jobless benefits seekers rose to 243K for the week ended July 12, well above the previous week’s revised 223K and vaulting over the forecast 230K. While jobless claims aren’t a market-mover, it helps add weight to expectations of a continued loosening in the US job market, a key component alongside inflation figures to help bully the Fed into a rate cutting cycle.
Dow Jones news
Despite easing back into the low end on Thursday, the Dow Jones is roughly on-balance, with about half of the index’s constituent equities in the green for the day. Intel Corp. (INTC) rose over 3% to $35.52 per share despite an overall decline in the chipmaking sector. Banking dominated the low end on Thursday, with JPMorgan Chase & Co. (JPM) and Goldman Sachs Group Inc. (GS) both declining. JPM shed -2.85% to $210.69 per share while GS eased lower -2.43% to $489.98 per share.
Dow Jones technical outlook
After hitting a fifth consecutive all-time high of 41,37138 on Thursday, the Dow Jones index eased back below 40,900.00 as bulls take a much-needed breather. The Dow Jones closed in the green for six straight trading days, rallying nearly 5.5% in the process.
The Dow Jones’ latest bullish push has sent prices well into record highs, and even Thursday’s moderate pullback of -300 points still leaves prices buried deep in bull country, trading nearly 4% above the 50-day Exponential Moving Average (EMA) at 39,345.00.
Dow Jones five minute chart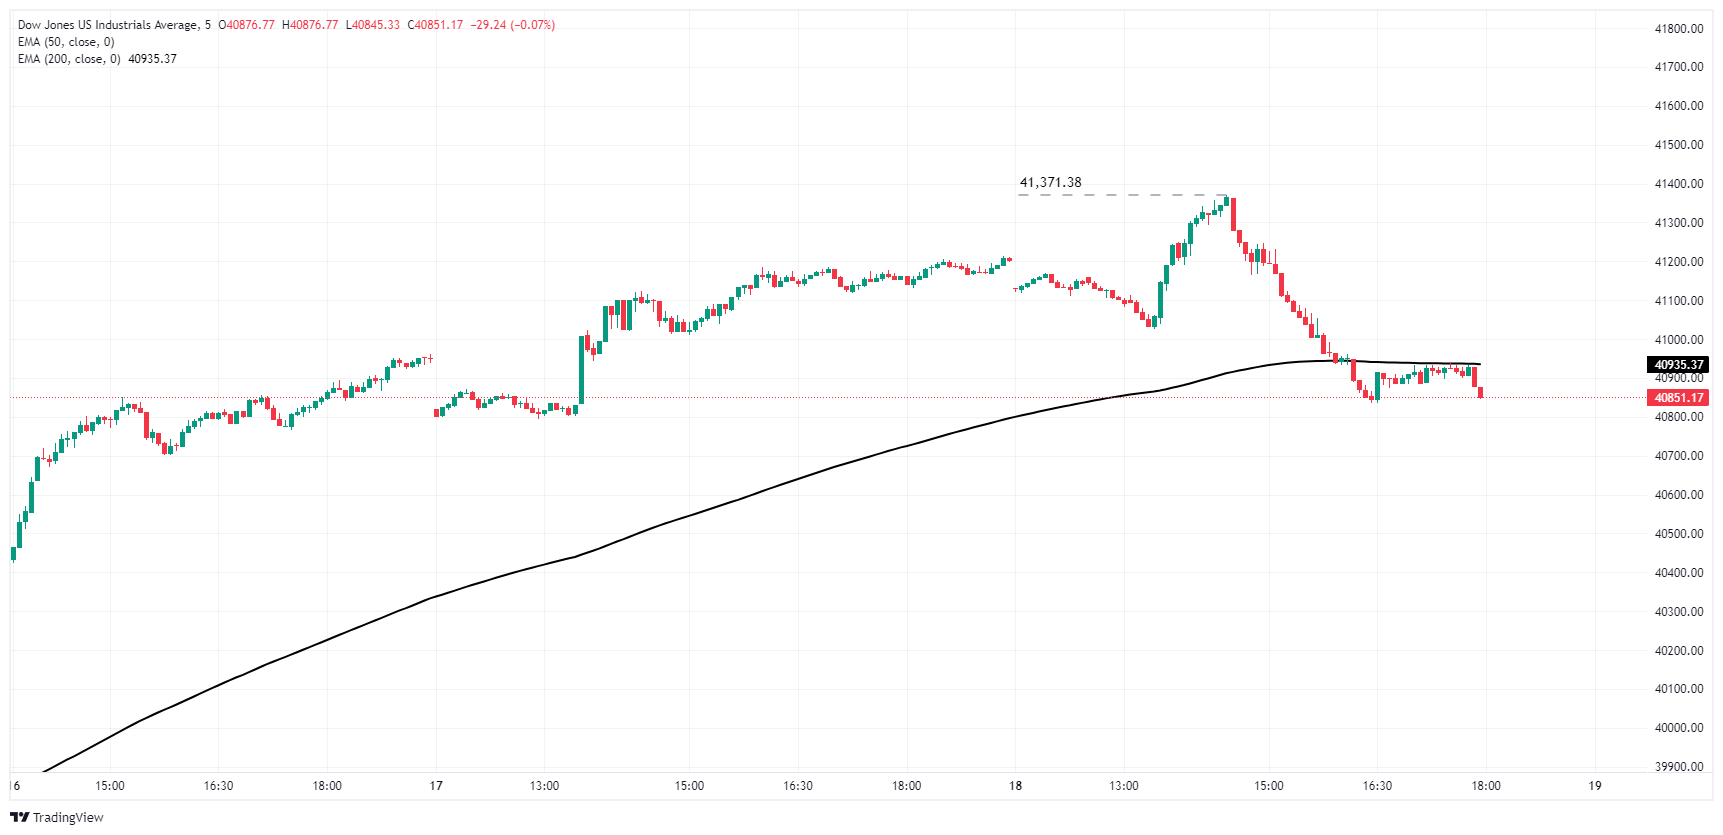
Dow Jones daily chart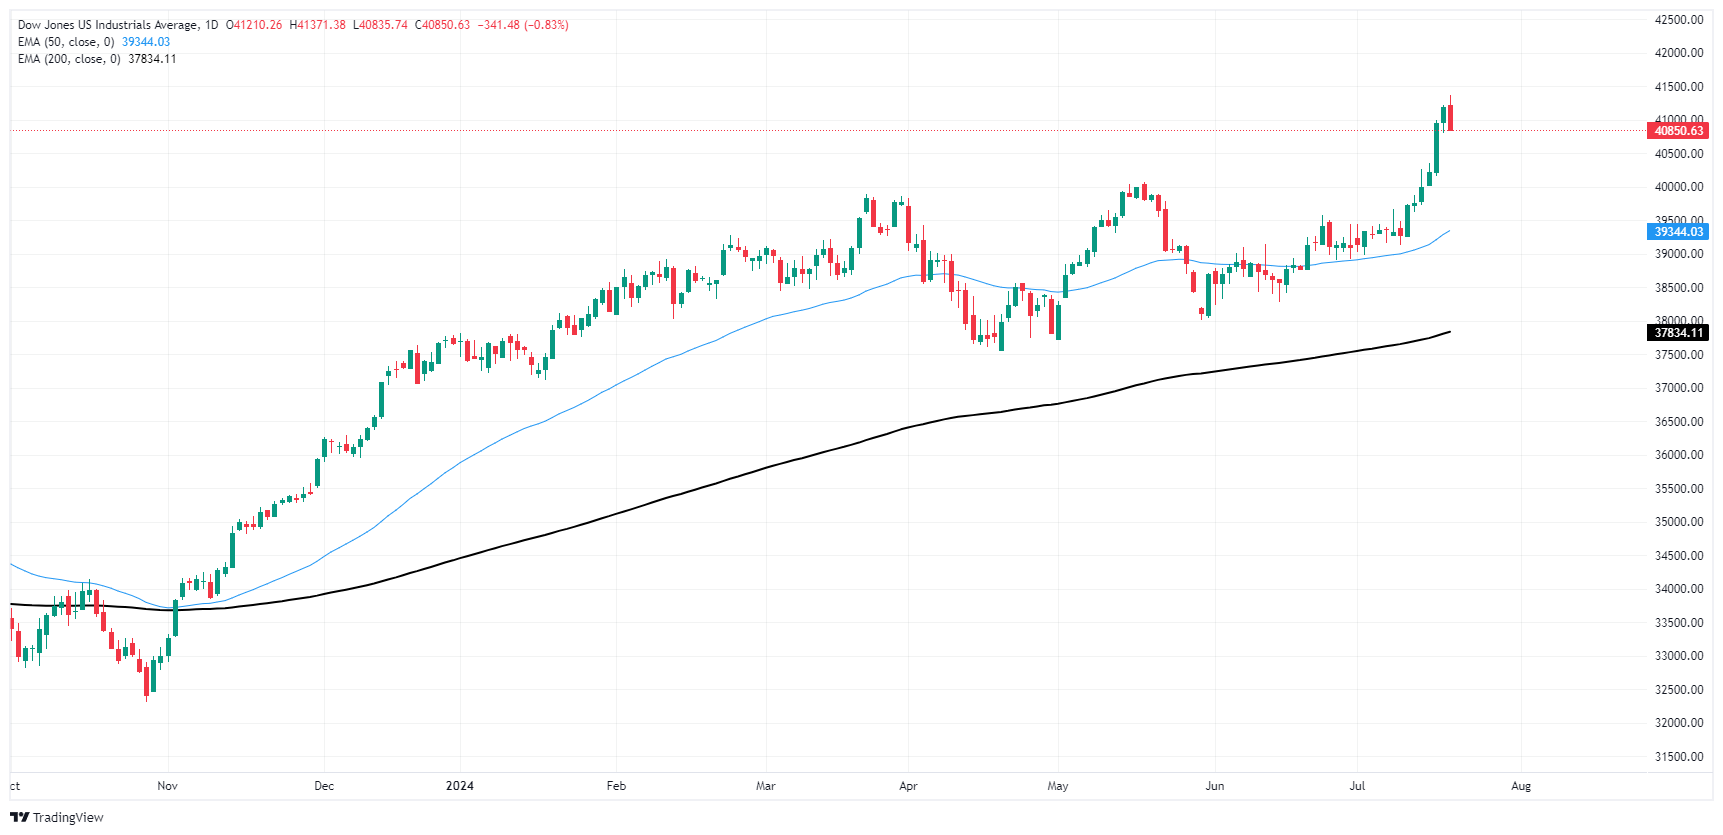
Dow Jones FAQs
The Dow Jones Industrial Average, one of the oldest stock market indices in the world, is compiled of the 30 most traded stocks in the US. The index is price-weighted rather than weighted by capitalization. It is calculated by summing the prices of the constituent stocks and dividing them by a factor, currently 0.152. The index was founded by Charles Dow, who also founded the Wall Street Journal. In later years it has been criticized for not being broadly representative enough because it only tracks 30 conglomerates, unlike broader indices such as the S&P 500.
Many different factors drive the Dow Jones Industrial Average (DJIA). The aggregate performance of the component companies revealed in quarterly company earnings reports is the main one. US and global macroeconomic data also contributes as it impacts on investor sentiment. The level of interest rates, set by the Federal Reserve (Fed), also influences the DJIA as it affects the cost of credit, on which many corporations are heavily reliant. Therefore, inflation can be a major driver as well as other metrics which impact the Fed decisions.
Dow Theory is a method for identifying the primary trend of the stock market developed by Charles Dow. A key step is to compare the direction of the Dow Jones Industrial Average (DJIA) and the Dow Jones Transportation Average (DJTA) and only follow trends where both are moving in the same direction. Volume is a confirmatory criteria. The theory uses elements of peak and trough analysis. Dow’s theory posits three trend phases: accumulation, when smart money starts buying or selling; public participation, when the wider public joins in; and distribution, when the smart money exits.
There are a number of ways to trade the DJIA. One is to use ETFs which allow investors to trade the DJIA as a single security, rather than having to buy shares in all 30 constituent companies. A leading example is the SPDR Dow Jones Industrial Average ETF (DIA). DJIA futures contracts enable traders to speculate on the future value of the index and Options provide the right, but not the obligation, to buy or sell the index at a predetermined price in the future. Mutual funds enable investors to buy a share of a diversified portfolio of DJIA stocks thus providing exposure to the overall index.
Recommended Articles


