

Dow Jones Industrial Average recovers after Tuesday’s post-Fed slump
- Dow Jones reversed an early decline and clawed into the green on Tuesday.
- Fed comments came in more hawkish than expected, rattling investor sentiment.
- The long wait to Fed rate cuts continues as US inflation data looms ahead.
The Dow Jones Industrial Average (DJIA) tumbled in early Tuesday trading after Federal Reserve (Fed) Chairman Jerome Powell delivered less-dovish-than-expected talking points while testifying on the Fed’s semiannual Monetary Policy Report in the first of two appearances in as many days. Market sentiment recovered after the fact, and the Dow Jones recovered into the green for the day.
On Tuesday, Fed Chairman Jerome Powell presented the Fed's semiannual Monetary Policy Report to the Senate Committee on Banking, Housing, and Urban Affairs. He emphasized the Fed's commitment to waiting for inflation to ease towards the 2% annual target, which disappointed investors hoping for signs of interest rate cuts. As a result, risk appetite decreased, and the US dollar strengthened.
Powell will deliver the second half of the report to the Congressional House Committee on Financial Services on Wednesday, and no changes in rhetoric or new information are expected.
Later this week, June's US Consumer Price Index (CPI) inflation is scheduled for Thursday, followed by Friday's US Producer Price Index (PPI) wholesale inflation. Core CPI in June is expected to remain at 3.4% YoY, while core PPI for the same period is projected to increase to 2.5% from the previous period's 2.3%. Meeting these forecasts may disappoint markets that are expecting a quarter-point rate cut from the Fed at the September 18 rate call due to the anticipation of slowing inflation.
Dow Jones news
Despite over half of the Dow Jones index being in the red on Tuesday, strong gains at the top of the board drag the overall equity average higher. Banking stocks are leading the charge higher, with Goldman Sachs Group Inc. (GS) climbing 2.77% to $477.89 per share, followed by JPMorgan Chase & Co. (JPM) climbing nearly 2% over $209.00 per share.
On the low side, Salesforce Inc. (CRM) has fallen back -1.91% on the day, battling with $252.00 per share as the customer tracking software company finds a halting recovery on promises of deeper AI integration into the company’s offerings.
Dow Jones technical outlook
Dow Jones initially plunged on Tuesday, dropping toward 39,120.00 before a sharp recovery rally to set an intraday high of 39,489.00. The DJIA is set to waffle back into Tuesday’s opening bids near 39,360.00.
Daily candles continue to churn in the midrange as price action gets squeezed between the 50-day Exponential Moving Average at 38,998.14 and a supply zone priced in near the 40,000.00 major handle.
Dow Jones five minute chart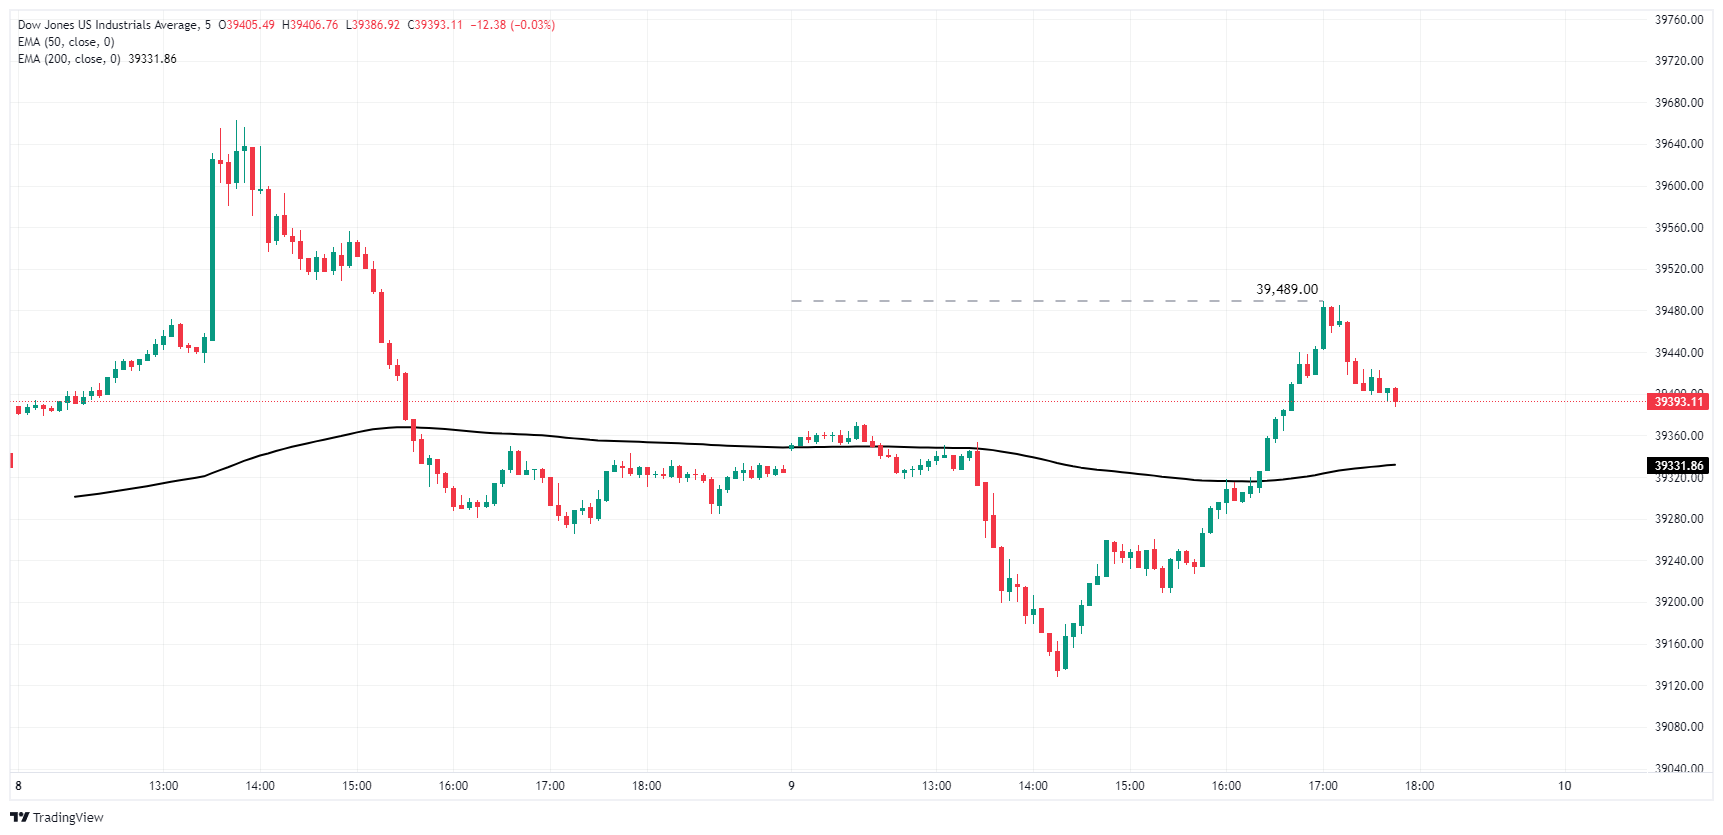
Dow Jones daily chart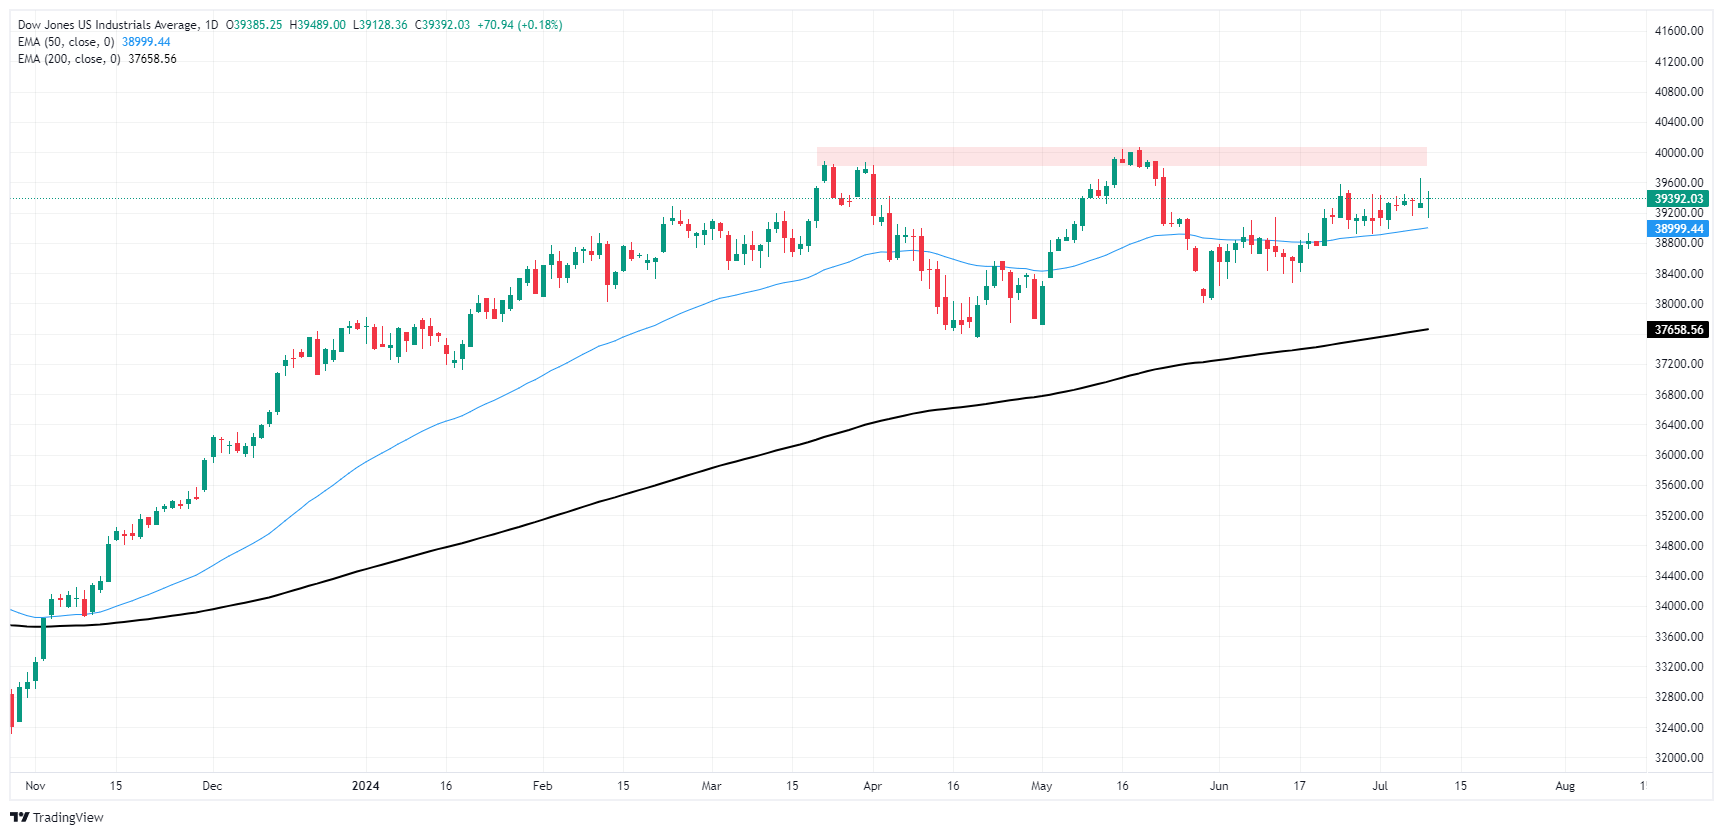
Dow Jones FAQs
The Dow Jones Industrial Average, one of the oldest stock market indices in the world, is compiled of the 30 most traded stocks in the US. The index is price-weighted rather than weighted by capitalization. It is calculated by summing the prices of the constituent stocks and dividing them by a factor, currently 0.152. The index was founded by Charles Dow, who also founded the Wall Street Journal. In later years it has been criticized for not being broadly representative enough because it only tracks 30 conglomerates, unlike broader indices such as the S&P 500.
Many different factors drive the Dow Jones Industrial Average (DJIA). The aggregate performance of the component companies revealed in quarterly company earnings reports is the main one. US and global macroeconomic data also contributes as it impacts on investor sentiment. The level of interest rates, set by the Federal Reserve (Fed), also influences the DJIA as it affects the cost of credit, on which many corporations are heavily reliant. Therefore, inflation can be a major driver as well as other metrics which impact the Fed decisions.
Dow Theory is a method for identifying the primary trend of the stock market developed by Charles Dow. A key step is to compare the direction of the Dow Jones Industrial Average (DJIA) and the Dow Jones Transportation Average (DJTA) and only follow trends where both are moving in the same direction. Volume is a confirmatory criteria. The theory uses elements of peak and trough analysis. Dow’s theory posits three trend phases: accumulation, when smart money starts buying or selling; public participation, when the wider public joins in; and distribution, when the smart money exits.
There are a number of ways to trade the DJIA. One is to use ETFs which allow investors to trade the DJIA as a single security, rather than having to buy shares in all 30 constituent companies. A leading example is the SPDR Dow Jones Industrial Average ETF (DIA). DJIA futures contracts enable traders to speculate on the future value of the index and Options provide the right, but not the obligation, to buy or sell the index at a predetermined price in the future. Mutual funds enable investors to buy a share of a diversified portfolio of DJIA stocks thus providing exposure to the overall index.
Recommended Articles


