

Dow Jones Industrial Average turns lower ahead of Fed rate call, ‘dot plot’ update
- Dow Jones backslides over 250 points as equities brace for Fed updates.
- Investors are icnreasingly concerned about the pace of rate cuts.
- Wednesday’s update to the Fed’s “dot plot” will draw plenty of attention.
The Dow Jones Industrial Average (DJIA) is struggling under the weight of investor trepidation ahead of Wednesday’s key Federal Reserve (Fed) outing. The Fed is broadly expected to hold rates in the 500-525 basis point range in June and July, but investors are worried that 2024 may see even less rate cuts than previously expected. The Fed’s “dot plot” of Interest Rate Expectations will be updated on Wednesday, and a fresh update on US Consumer Price Index (CPI) inflation will also drop on markets.
Yields on US Treasuries slightly declined on Tuesday, with 10-Year Notes easing to 4.438% from 4.483%, helping to bolster the mood and giving equities a late leg up. However market focus remains on Wednesday’s double-header of US CPI inflation and Fed “dot plot” update.
Rate markets are still holding out hope for a quarter-point cut in September, and according to the CME’s FedWatch Tool, interest rate traders are pricing in 51% odds of at least a 25 basis point cut on September 18. However, any big shifts in the Fed’s interest rate expectations could spark a flurry of action in either direction depending on the Fed’s outlook.
Dow Jones news
Nearly all of the Dow Jones’ constituent equities are seeing declines on Tuesday, with firm gains from Apple Inc. (AAPL) doing nearly all of the heavy lifting. Apple hit a fresh 52-week high of $205.46, climbing 12.34 points and gaining 6.4% on the day as investors continue to scoop up anything that references AI tech.
An increasingly-negative outlook on the US economy has been gripping investors this week, sending critical stocks broadly lower. Boeing Co. (BA) fell -3.2% to $184.05 per share, closely followed by American Express Co. which fell -3.07% to $225.30 per share.
Dow Jones technical outlook
The Dow Jones is the worst-performing of the major American equity indexes on Tuesday, declining over 250 points and falling below 38,600.00. The Dow Jones plunged to 38,425.00 in early trading, but recovery momentum remains limited.
A long-term demand zone rests just below 38,000.00 to prop up any extended declines, but buyers will have their work cut out for them if they want to push the Dow Jones back into fresh all-time-highs above 40,000.00.
Dow Jones five minute chart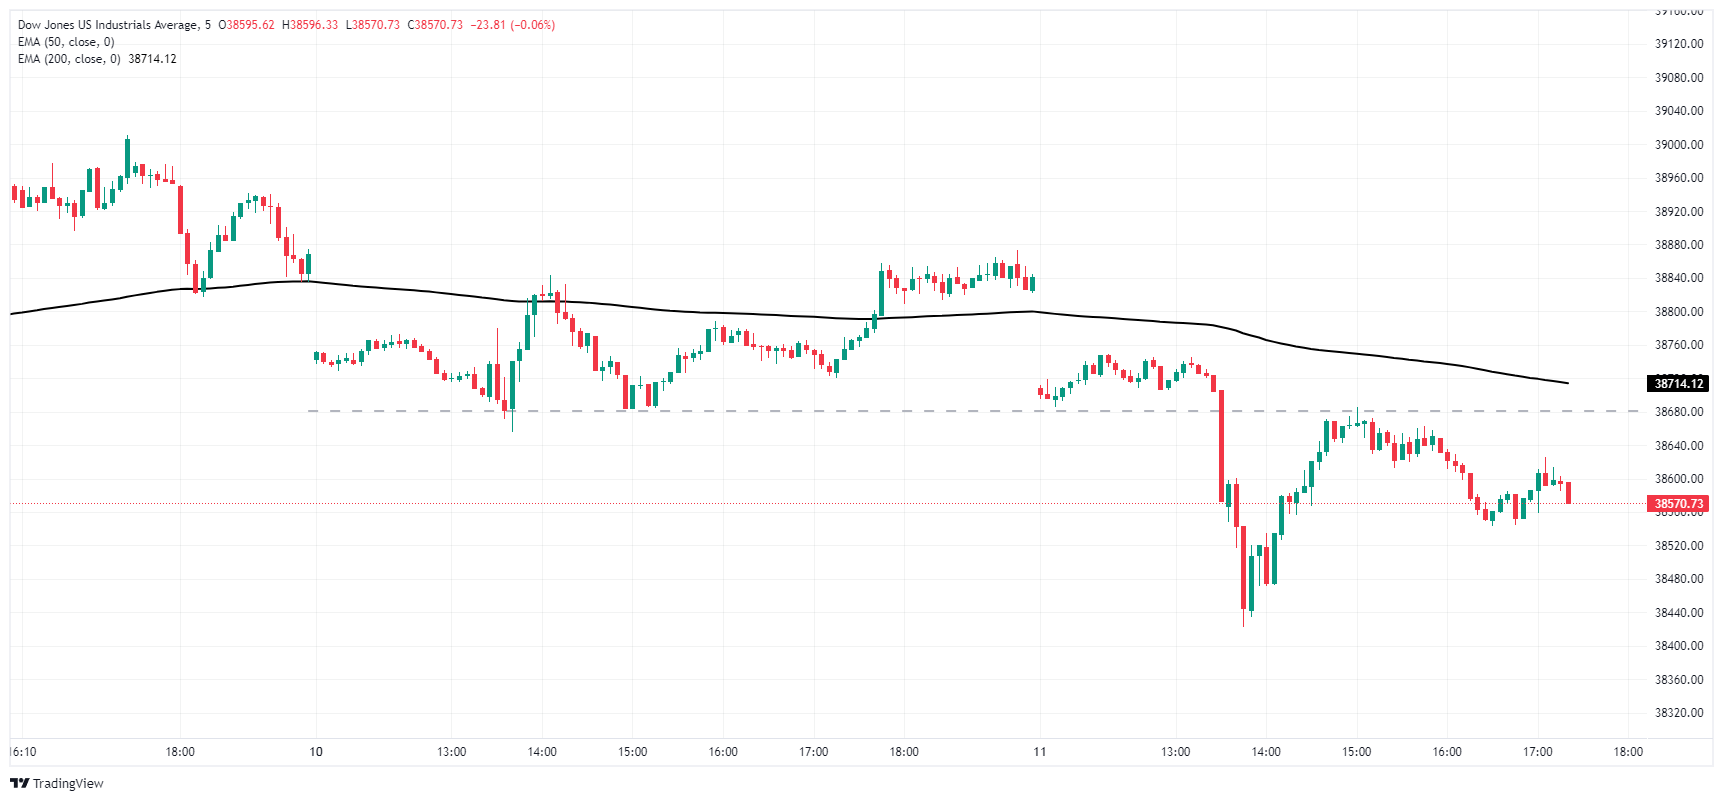
Dow Jones daily chart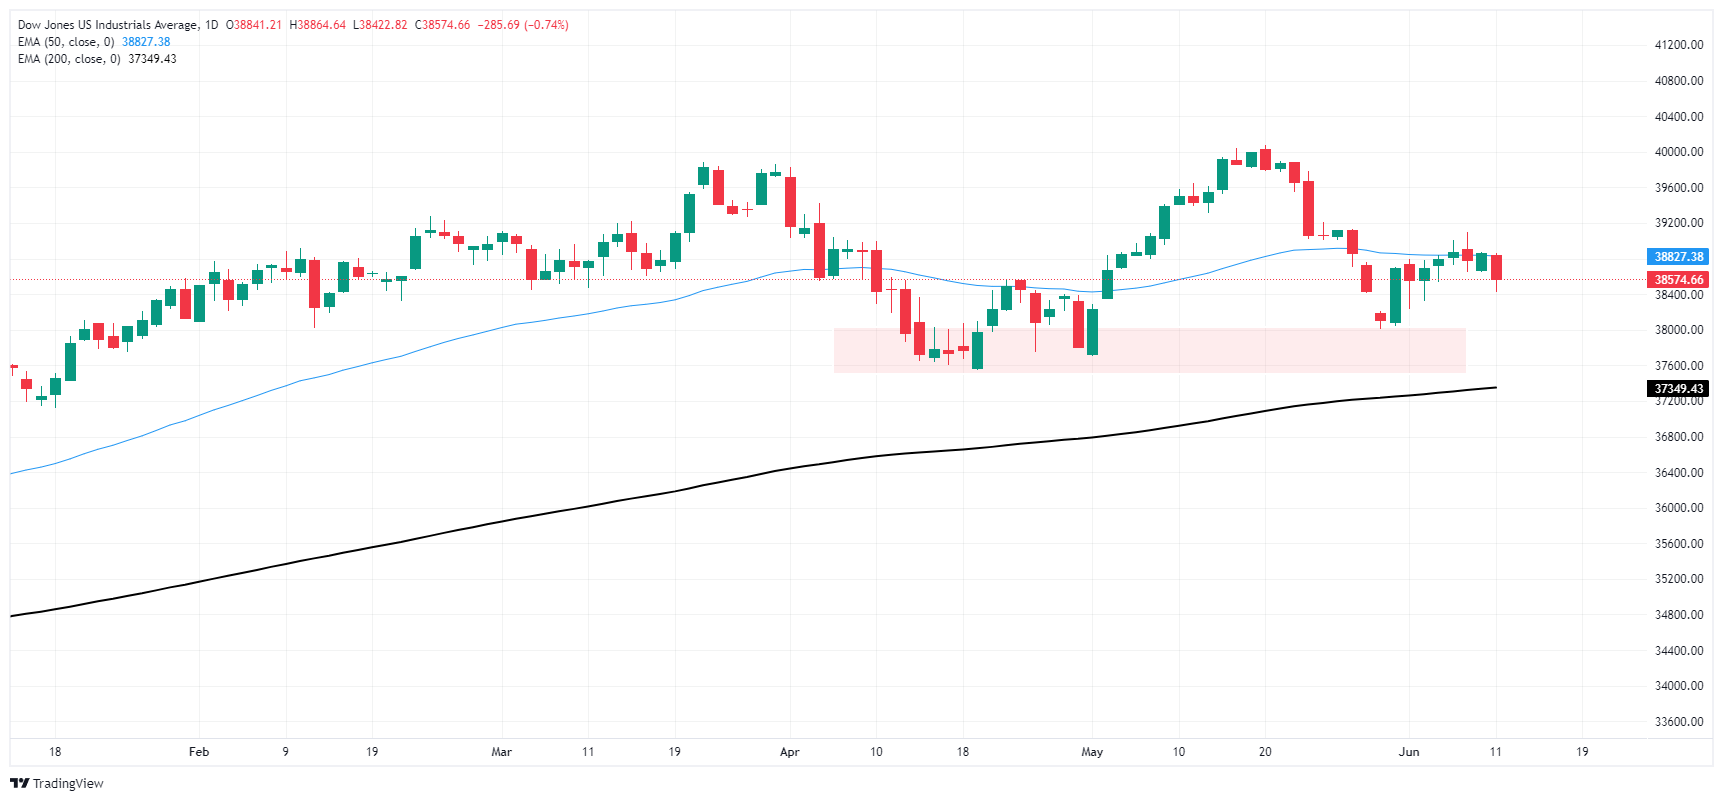
Dow Jones FAQs
The Dow Jones Industrial Average, one of the oldest stock market indices in the world, is compiled of the 30 most traded stocks in the US. The index is price-weighted rather than weighted by capitalization. It is calculated by summing the prices of the constituent stocks and dividing them by a factor, currently 0.152. The index was founded by Charles Dow, who also founded the Wall Street Journal. In later years it has been criticized for not being broadly representative enough because it only tracks 30 conglomerates, unlike broader indices such as the S&P 500.
Many different factors drive the Dow Jones Industrial Average (DJIA). The aggregate performance of the component companies revealed in quarterly company earnings reports is the main one. US and global macroeconomic data also contributes as it impacts on investor sentiment. The level of interest rates, set by the Federal Reserve (Fed), also influences the DJIA as it affects the cost of credit, on which many corporations are heavily reliant. Therefore, inflation can be a major driver as well as other metrics which impact the Fed decisions.
Dow Theory is a method for identifying the primary trend of the stock market developed by Charles Dow. A key step is to compare the direction of the Dow Jones Industrial Average (DJIA) and the Dow Jones Transportation Average (DJTA) and only follow trends where both are moving in the same direction. Volume is a confirmatory criteria. The theory uses elements of peak and trough analysis. Dow’s theory posits three trend phases: accumulation, when smart money starts buying or selling; public participation, when the wider public joins in; and distribution, when the smart money exits.
There are a number of ways to trade the DJIA. One is to use ETFs which allow investors to trade the DJIA as a single security, rather than having to buy shares in all 30 constituent companies. A leading example is the SPDR Dow Jones Industrial Average ETF (DIA). DJIA futures contracts enable traders to speculate on the future value of the index and Options provide the right, but not the obligation, to buy or sell the index at a predetermined price in the future. Mutual funds enable investors to buy a share of a diversified portfolio of DJIA stocks thus providing exposure to the overall index.
Recommended Articles


