

Dow Jones bounces up amid strong US data and hawkish Fed comments
- Dow Jones index advances on more favorable risk environment.
- US equity markets remain positive despite strong macroeconomic data, hawkish comments from Fed’s Williams.
- Broader Dow Jones trend remains negative, on corrective reversal from March highs.
The Dow Jones Industrial Average (DJIA) is finally posting gains in January as investors digest the strong US economic outlook and pare back their interest rate cut hopes.
US jobless claims and manufacturing activity figures have endorsed the view of strong economic momentum and a tight labour market. Beyond that, New York Federal Reserve (Fed) President John Williams has echoed the words from Chair Jerome Powell by stating that there is no rush to cut rates.
All the main Wall Street indices are trading higher. The Dow Jones, advances 0.6% to 37,979, while the S&P 500 gains 0.44% to 5,043. The NASDAQ lags with a 0.4% gain to 15,743.
Dow Jones news
Most of the sectors are trading in the green on Thursday with Communication Services leading with a 1% advance, followed by Financials, up 0.9%, and Industrials, 0.6% above its opening level. At the bottom, Utilities and Energy are practically flat.
United Health (UNH) rose 3.1% to $493.51 and is the best performer for the second day in a row, fuelled by the strong quarterly earnings results. Next is Travelers Companies (TRV) with a 1.6% gain to $209.79. Salesforce is leading losses with a 1.1% decline to $273.23, followed by Intel (INTC), down 0.4% to $35.53.
Dow Jones technical outlook
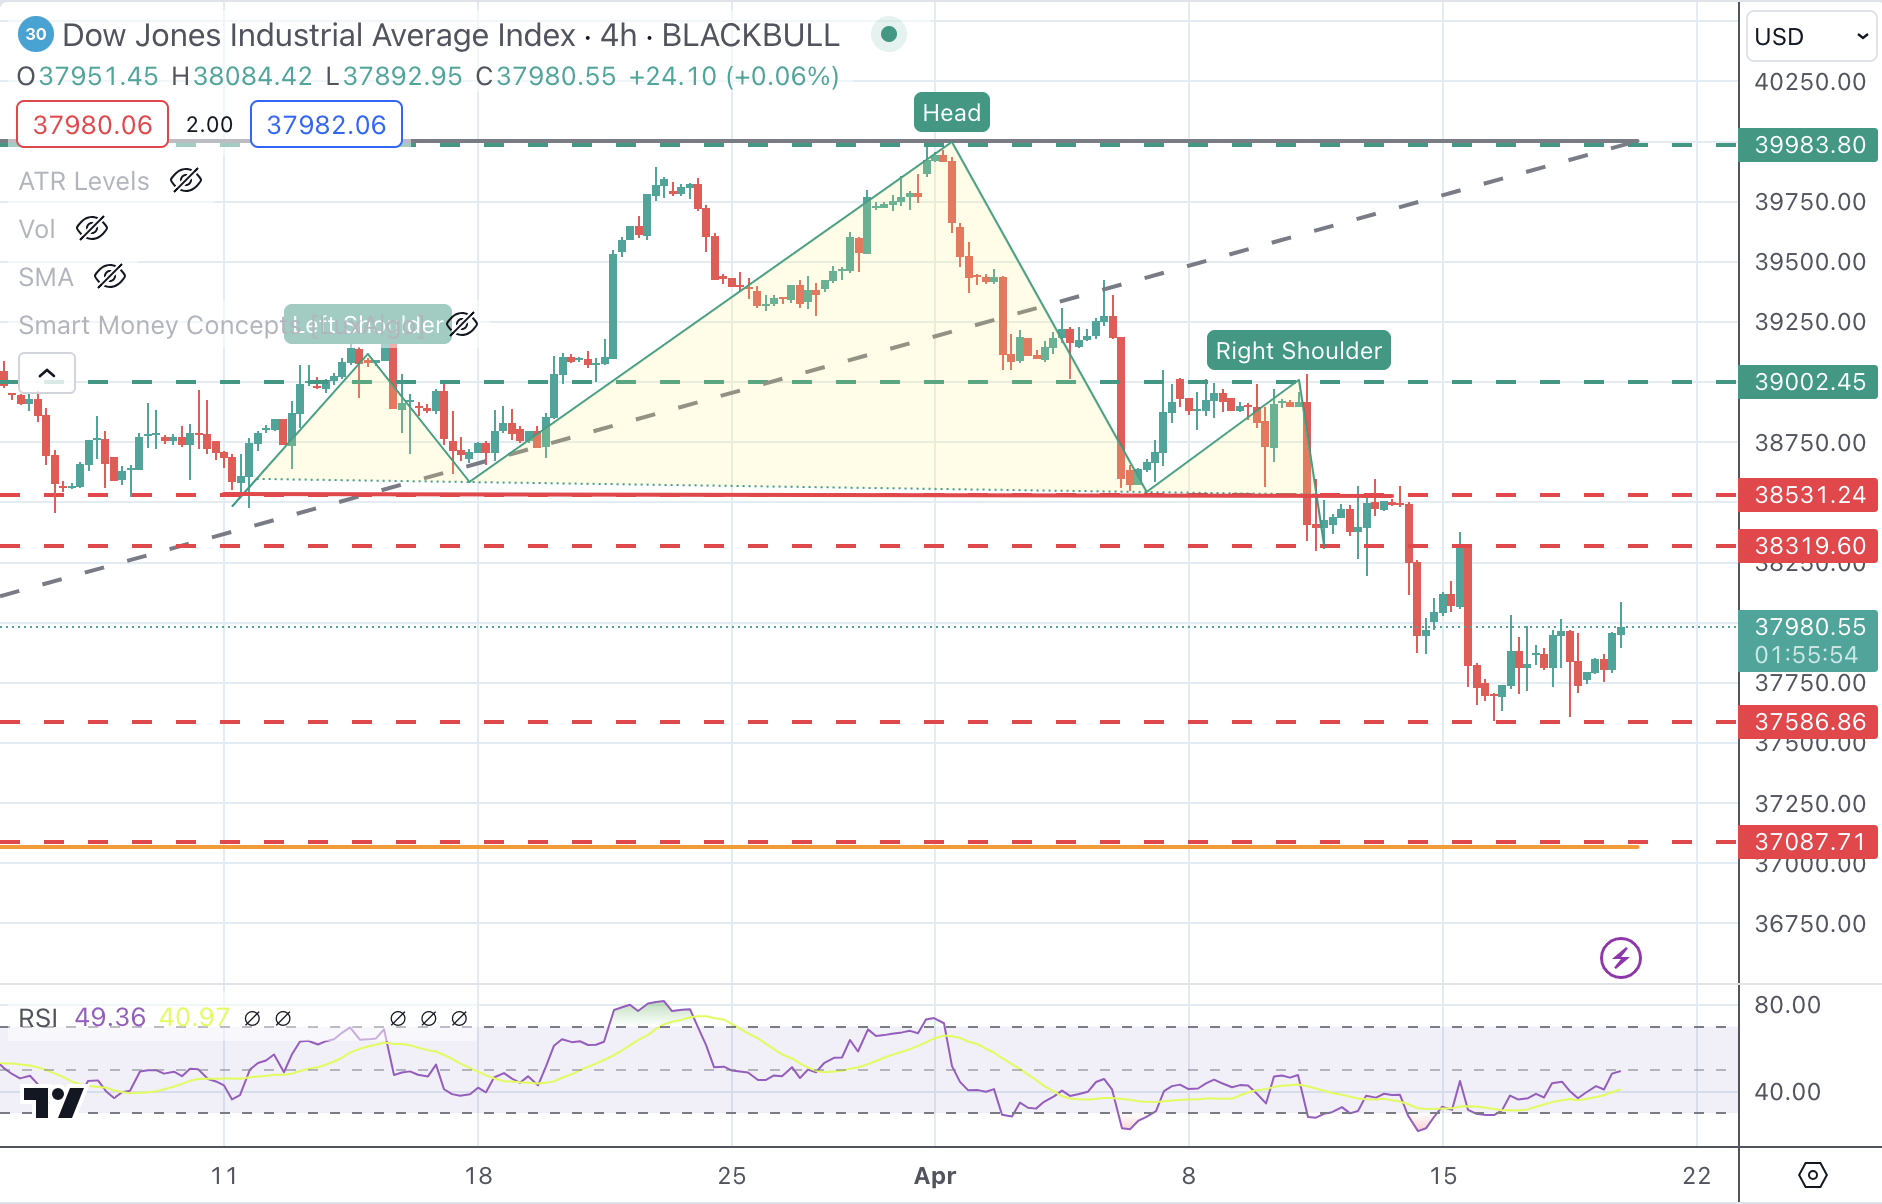
The DJIA is trimming some of last week’s losses, although the overall picture remains bearish. The move below 38,560 has activated a Head & Shoulders pattern that points toward a sharper decline.
Immediate support is 37,586, followed by the measured target of the H&S pattern, which meets the mid-January low and 38.6% Fibonacci retracement at 37,087. A bullish reaction might find resistance at the 38,531 previous support ahead of the 39,000 region (order block).
Dow Jones 4-Hour Chart
S&P 500 FAQs
The S&P 500 is a widely followed stock price index which measures the performance of 500 publicly owned companies, and is seen as a broad measure of the US stock market. Each company’s influence on the computation of the index is weighted based on market capitalization. This is calculated by multiplying the number of publicly traded shares of the company by the share price. The S&P 500 index has achieved impressive returns – $1.00 invested in 1970 would have yielded a return of almost $192.00 in 2022. The average annual return since its inception in 1957 has been 11.9%.
Companies are selected by committee, unlike some other indexes where they are included based on set rules. Still, they must meet certain eligibility criteria, the most important of which is market capitalization, which must be greater than or equal to $12.7 billion. Other criteria include liquidity, domicile, public float, sector, financial viability, length of time publicly traded, and representation of the industries in the economy of the United States. The nine largest companies in the index account for 27.8% of the market capitalization of the index.
There are a number of ways to trade the S&P 500. Most retail brokers and spread betting platforms allow traders to use Contracts for Difference (CFD) to place bets on the direction of the price. In addition, that can buy into Index, Mutual and Exchange Traded Funds (ETF) that track the price of the S&P 500. The most liquid of the ETFs is State Street Corporation’s SPY. The Chicago Mercantile Exchange (CME) offers futures contracts in the index and the Chicago Board of Options (CMOE) offers options as well as ETFs, inverse ETFs and leveraged ETFs.
Many different factors drive the S&P 500 but mainly it is the aggregate performance of the component companies revealed in their quarterly and annual company earnings reports. US and global macroeconomic data also contributes as it impacts on investor sentiment, which if positive drives gains. The level of interest rates, set by the Federal Reserve (Fed), also influences the S&P 500 as it affects the cost of credit, on which many corporations are heavily reliant. Therefore, inflation can be a major driver as well as other metrics which impact the Fed decisions.
Recommended Articles


