
Top Crypto Gainers: PENGU leads the market gains amid San Diego Comic Con return, KAS and RAY follow
- Pudgy Penguins extend the 20% rise from Monday, fueled by the announcement of its San Diego Comic Con 2025 return.
- Kaspa ticks higher by over 1% following its 17% jump on Monday, with bulls targeting key resistance breakout.
- Raydium edges higher by nearly 4% amid increasing bullish momentum.
Pudgy Penguins (PENGU) edges higher by nearly 2% at press time on Tuesday, extending the 20% gains from Monday. The meme coin’s sudden rise, outpacing the broader cryptocurrency market in the last 24 hours, could be connected to its return to San Diego Comic-Con 2025.
Furthermore, Kaspa (KAS) and Raydium (RAY) post double-digit gains as the altcoins market heats up. The bullish run in PENGU, KAS, and RAY hits a key resistance level, with bulls targeting further gains.
PENGU’s bull run hits a crucial resistance level
PENGU hits a crucial resistance at $0.03731, aligning with the 78.6% Fibonacci level, which is drawn from $0.07000 on December 17 to $0.00370 on April 9. The meme coin has recorded over 150% surge so far in July, reflecting the intense bullish run in motion.
A potential daily close above $0.03731 could stretch the recovery run to the $0.05000 psychological level.
The Moving Average Convergence/Divergence (MACD) and its signal line regain an uptrend, fueled by the resurgence of green histogram bars above the zero line, indicating increased bullish momentum.
The Relative Strength Index (RSI) reads 88 on the daily chart as it consolidates in the overbought zone, indicating heightened buying pressure.
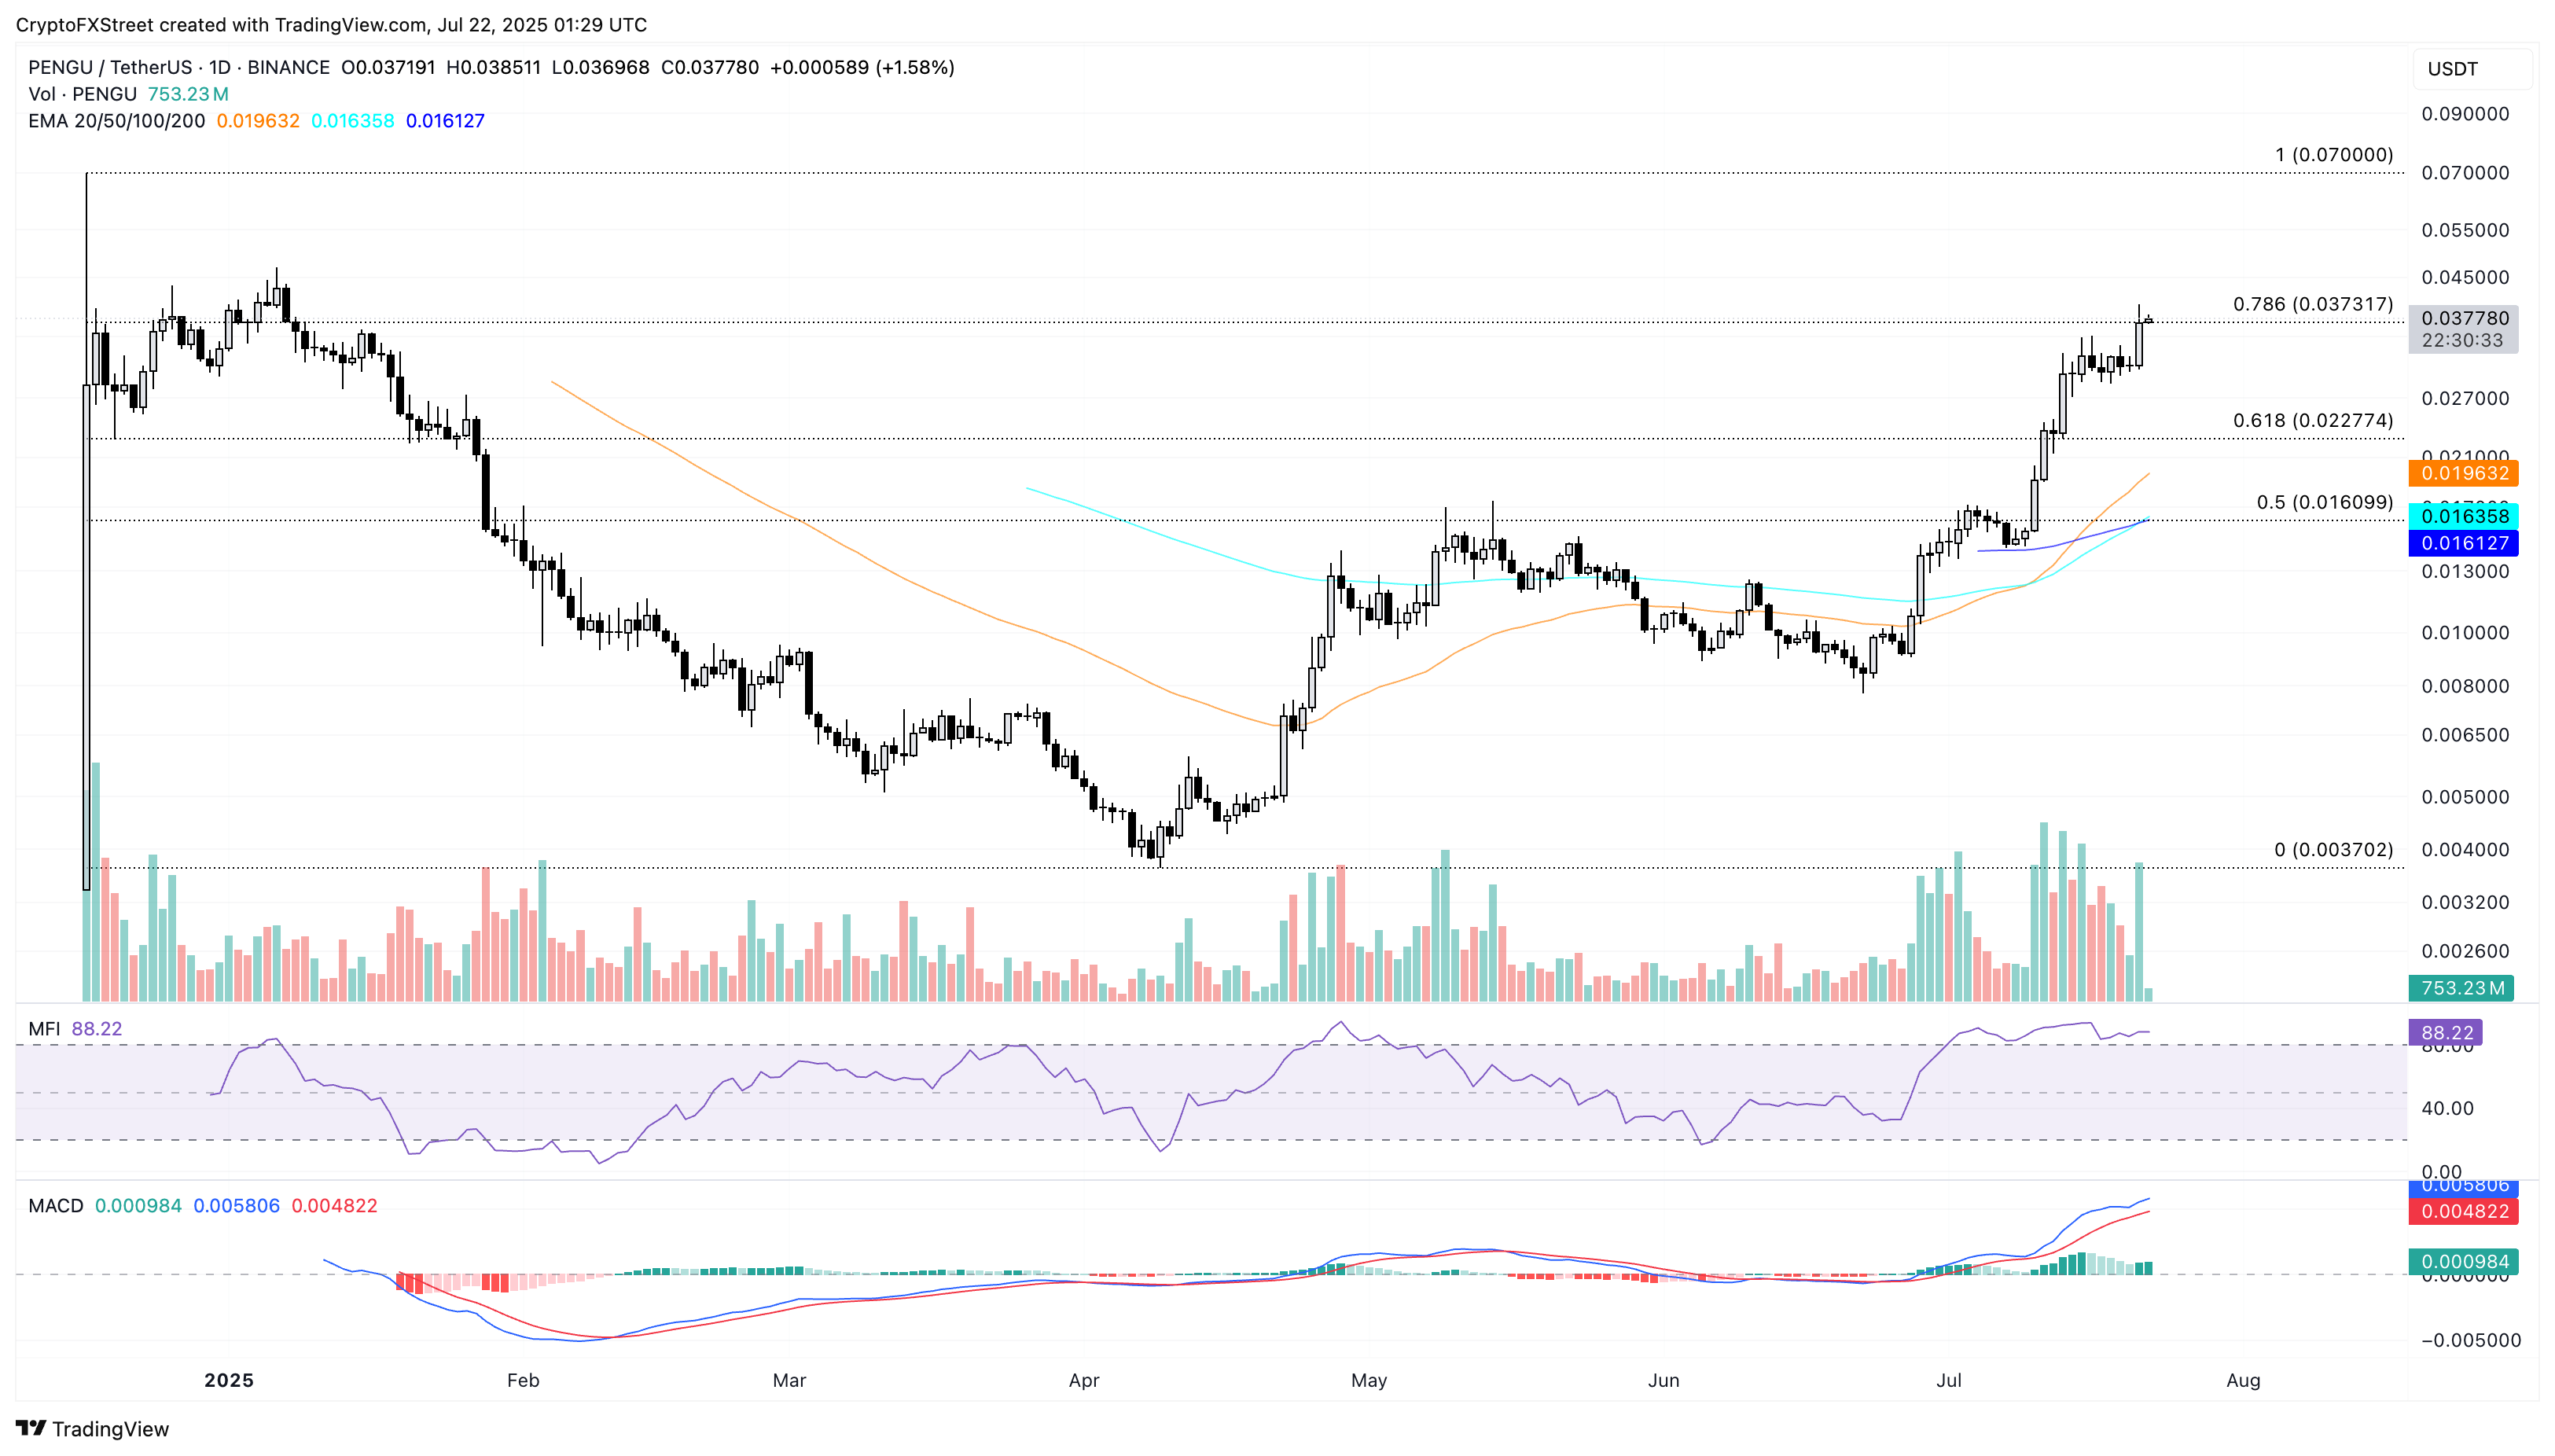
PENGU/USDT daily price chart.
On the downside, a reversal in PENGU from $0.03731 could extend the decline to the 61.8% Fibonacci level at $0.02277.
Kaspa’s wedge breakout rally eyes further gains
Kaspa extends the uptrend with a fourth consecutive bullish candle as it nears the $0.1172 resistance level. The falling wedge breakout rally marked a trend reversal in KAS, accounting for over 50% surge so far in July.
A decisive push above the $0.1172 level could extend the uptrend to $0.1311, marked by the May 12 high.
The MACD indicator, with rising green histogram bars and the RSI at 84 on the daily chart, suggests increasing bullish momentum.
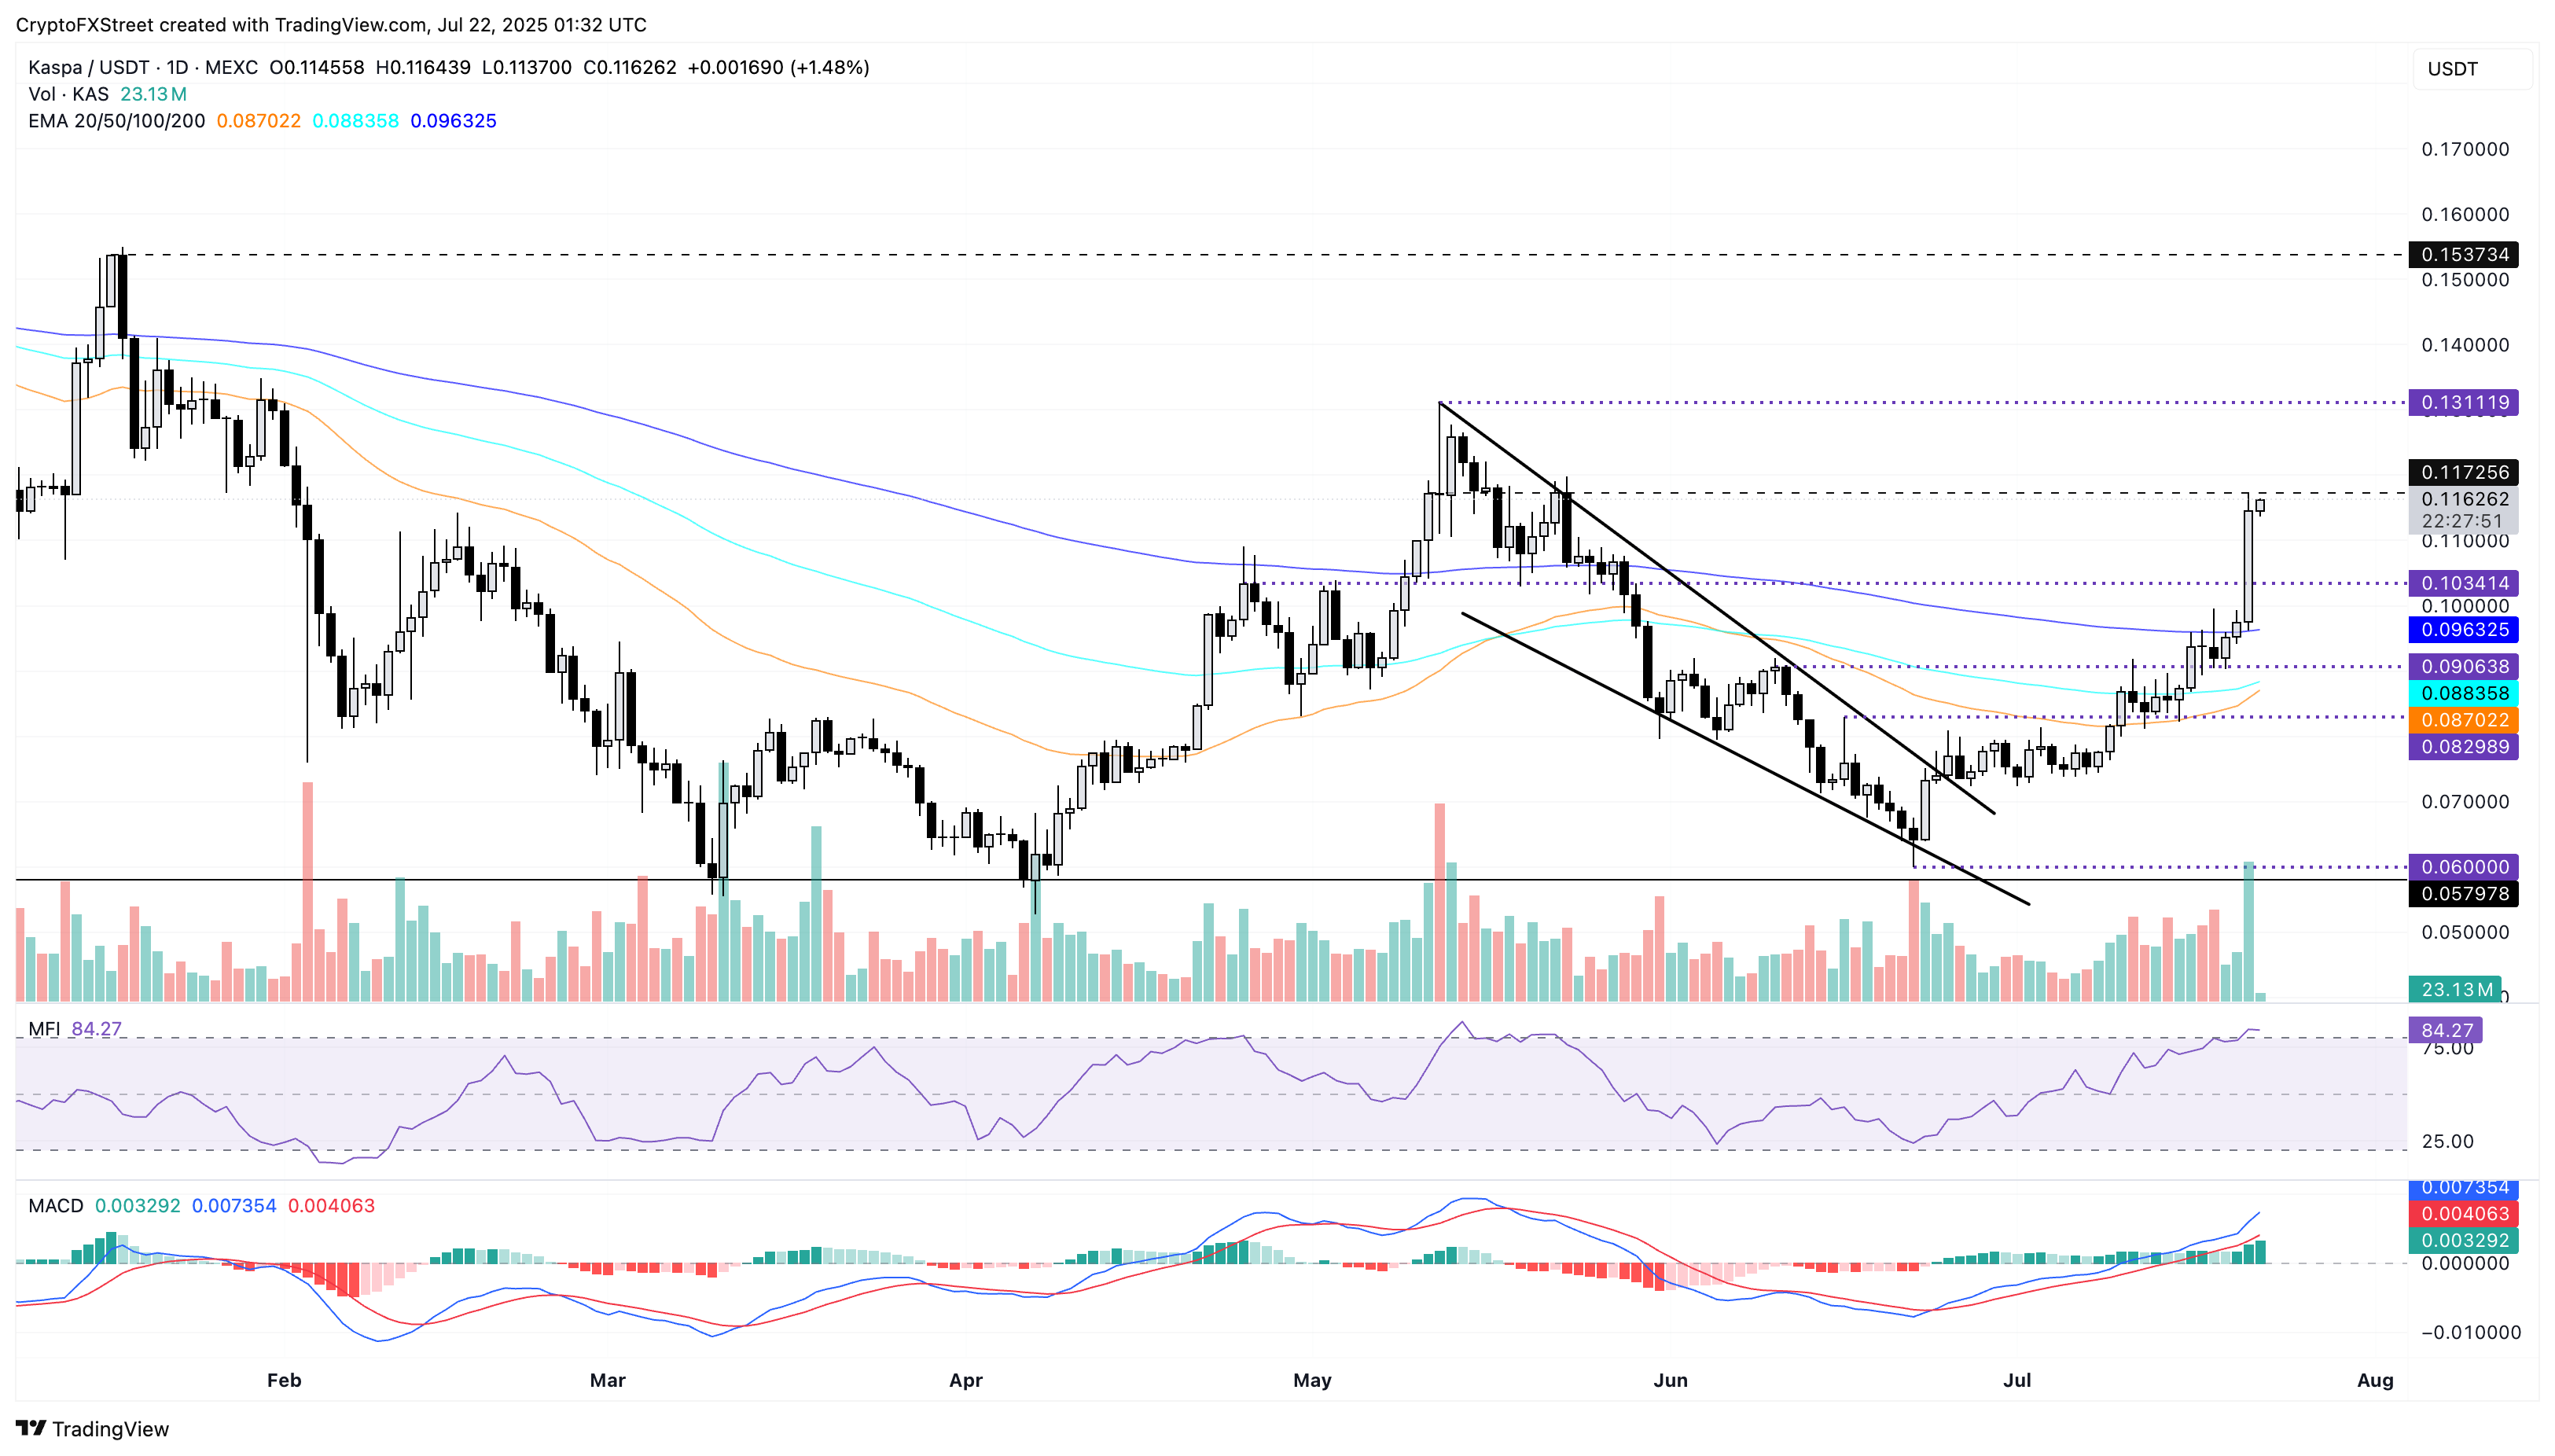
KAS/USDT daily price chart.
On the contrary, a reversal from the $0.1172 level could result in a retest of the $0.1000 psychological mark.
Raydium’s increasing bullish momentum targets $4
Raydium edges higher by over 7% at press time on Tuesday, printing its fourth consecutive bullish candle and extending the 10% gains from Monday. The bullish run exceeds the $3.41 resistance, last tested on Monday.
A decisive close above this level could stretch the uptrend to reclaim the $4.00 round figure.
The MACD indicator displays a resurgence of green histogram bars, and the RSI stands at 76 as it hovers near the overbought boundary, indicating increased bullish momentum.
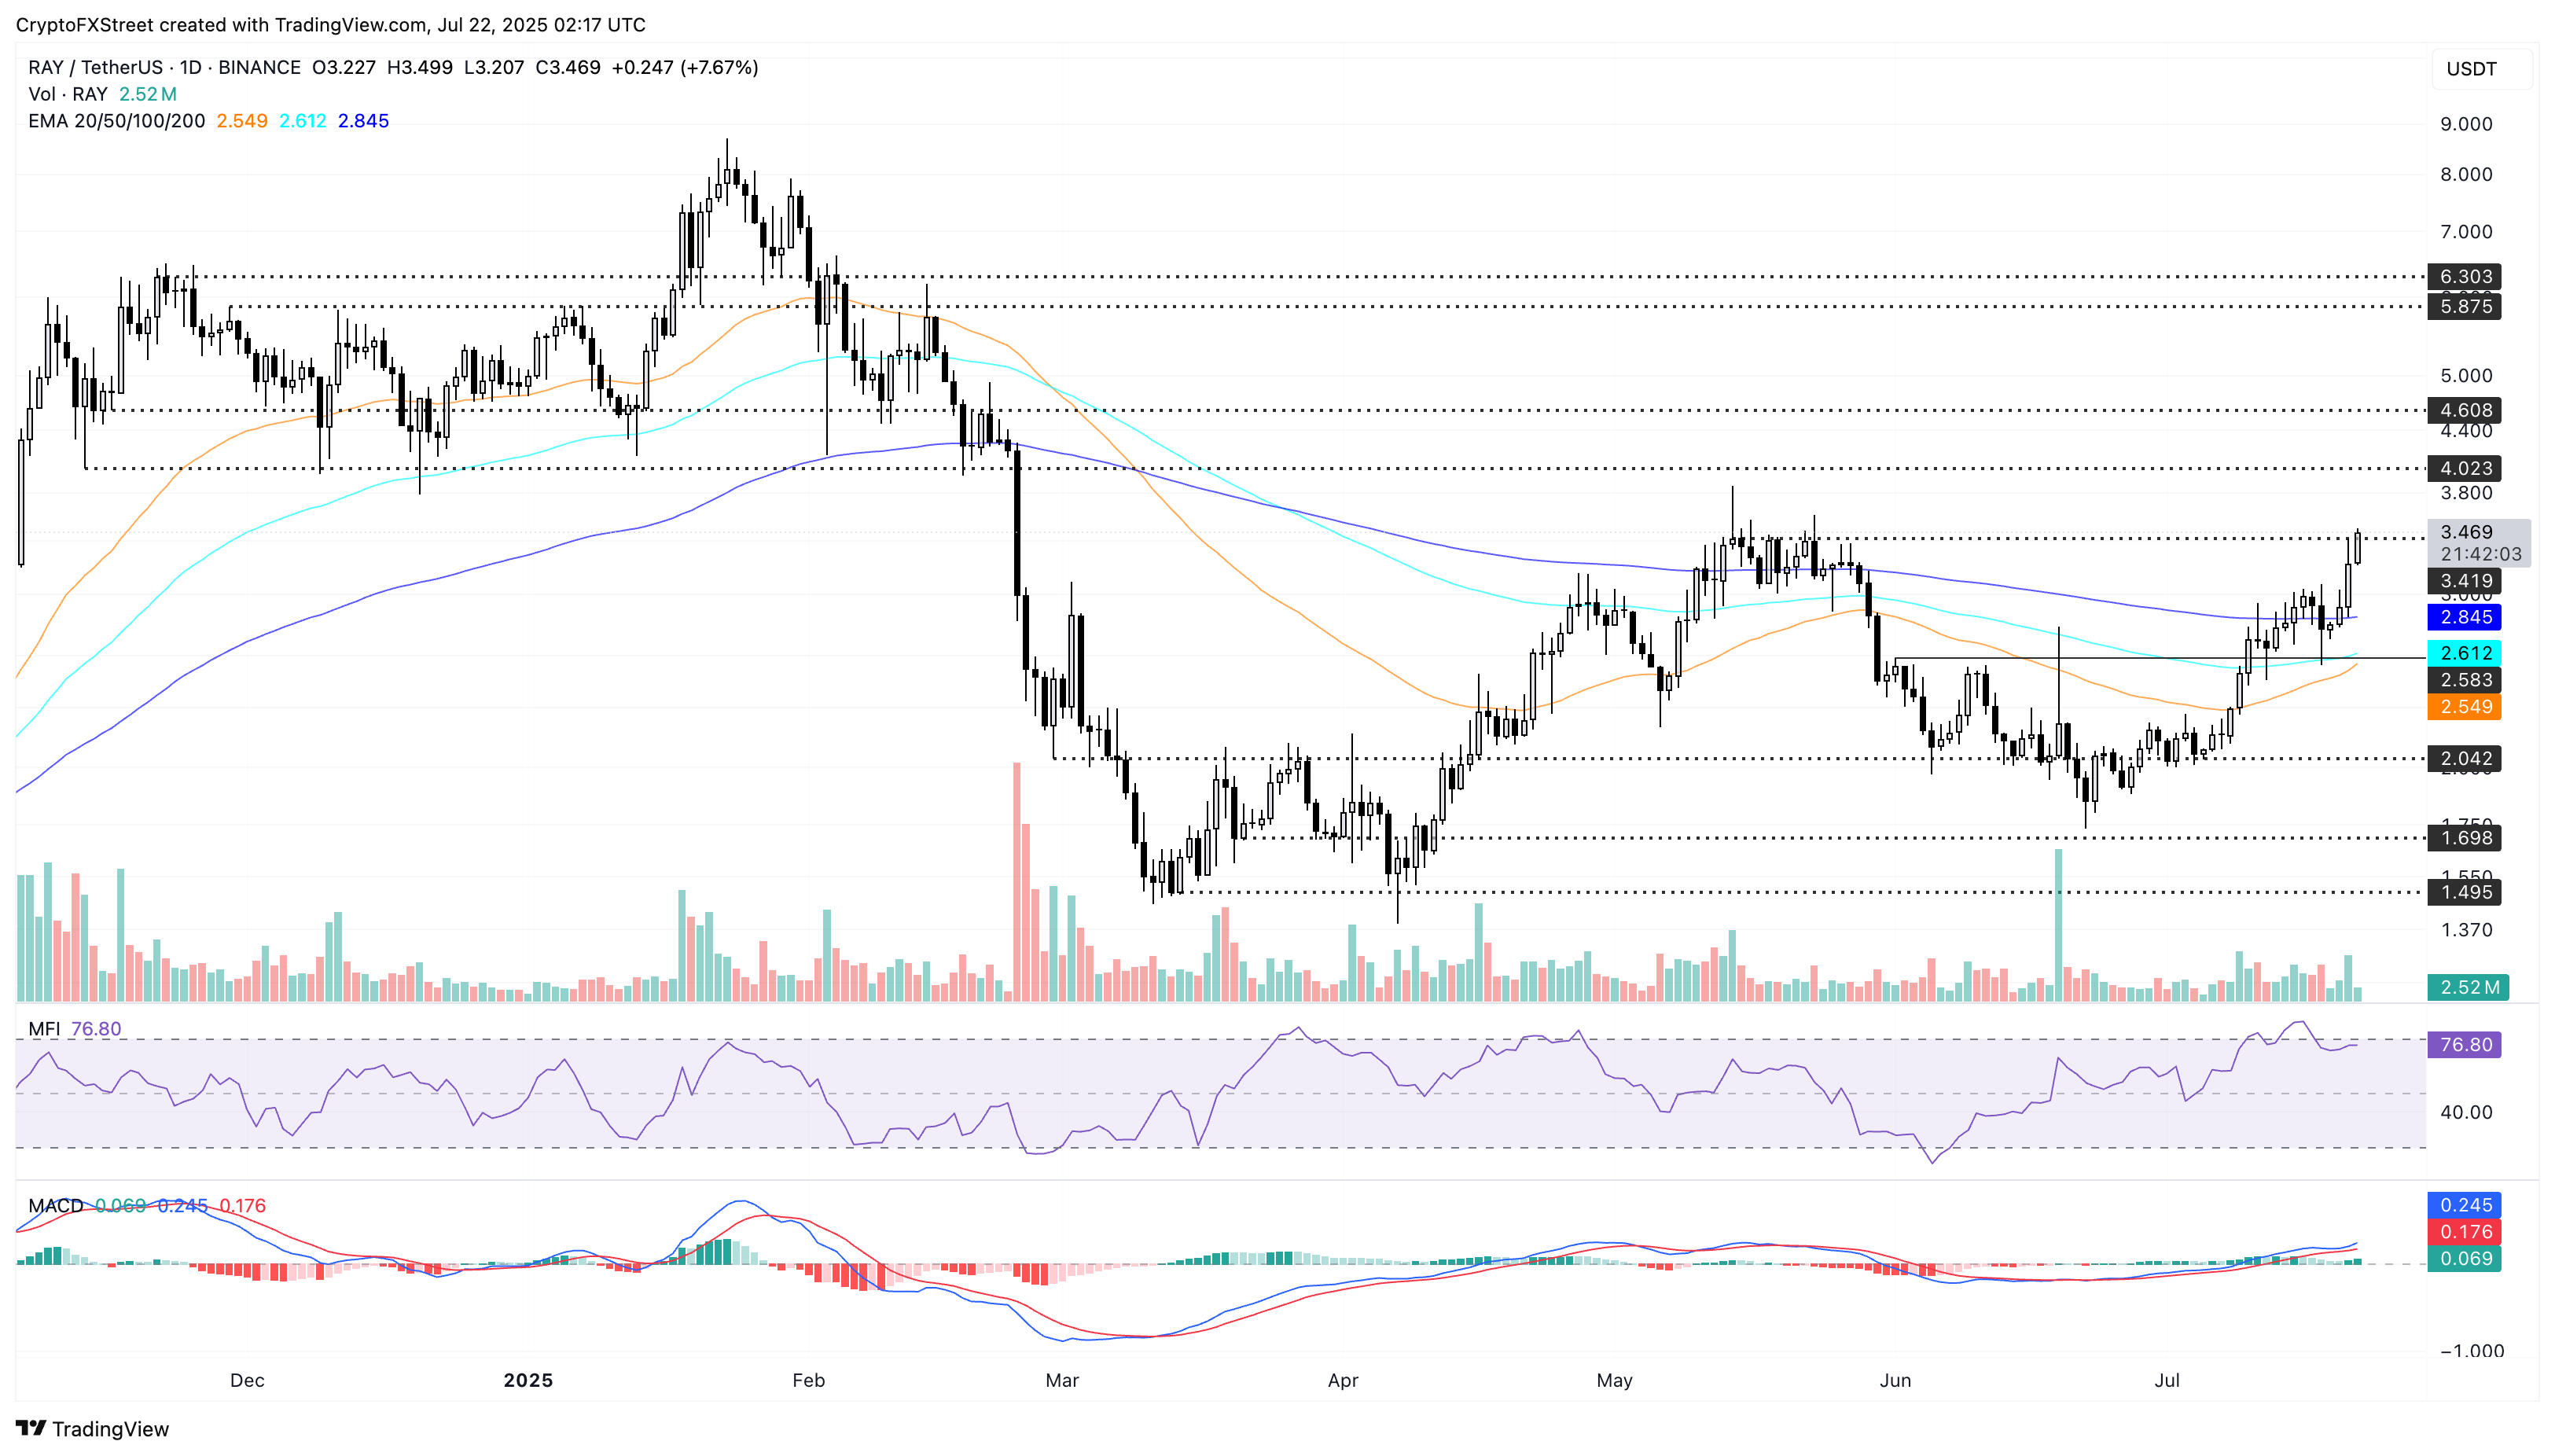
RAY/USDT daily price chart.
On the downside, a failure to hold above $3.41 could result in a reversal to the 200-day Exponential Moving Average (EMA) at $2.84.
Recommended Articles


