

Cardano active wallets increase to highest since late 2022 ahead of USDM stablecoin rollout
- The launch of the USDM stablecoin in the United States is expected to enhance growth of Cardano's DeFi sector.
- Active wallets on the network exceed the 600,000 mark for the first time since late 2022 in anticipation of the rollout.
- Increased network activity suggests a correlation with price action as ADA briefly broke the $0.80 resistance before experiencing a correction.
Cardano (ADA) broke the $0.8 resistance level on Thursday after trading below it for 21 months, although it quickly corrected afterward following a broader retreat in cryptocurrency prices. In the weekly time frame, however, Cardano price appears to be in an uptrend which could be further supported by the upcoming launch of its stablecoin, USDM, in the United States.
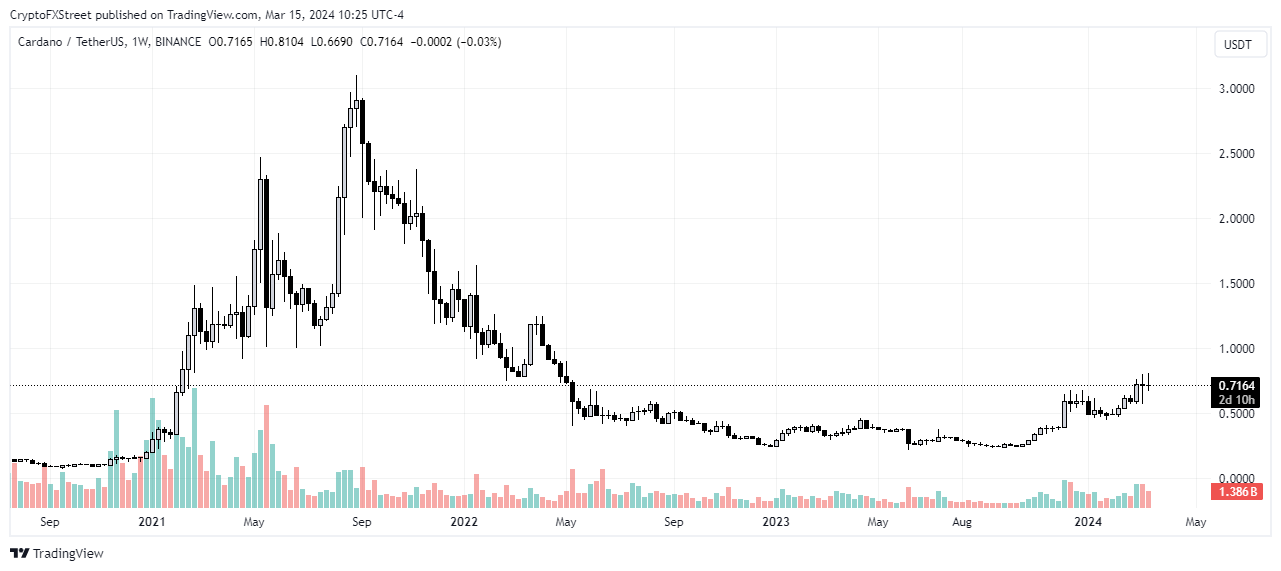
ADA/USDT 7-days chart
Cardano’s USDM to launch in the United States on Saturday
Mehen Finance LLC plans to roll out the USDM stablecoin across 19 states in the US with a direct fiat on-ramp to the Cardano ecosystem. The coin is fully fiat collateralized, with each USDM pegged 1:1 to the US Dollar (USD).
The launch, only 24 hours away, is poised to attract new users to the smart contract blockchain platform and allow them access to improved web3 features that were previously impossible on Cardano.
In addition, USDM will serve as a major boost to Cardano's DeFi ecosystem, which has suffered from slow growth due to a lack of crypto infrastructure. It would serve as a reliable trading pair to projects within Cardano, attracting more users and increasing liquidity in the process. This could also act as a signal for DeFi protocols that have been skeptical about launching on the blockchain platform.
Active wallets hit a major milestone
A few months back, in September 2023 precisely, active wallets on Cardano were at a low of around 300,000. However, with the launch imminent on Saturday, that number has crossed 600,000, a height last seen in September 2022, according to data from Danogo, a DEX on Cardano.
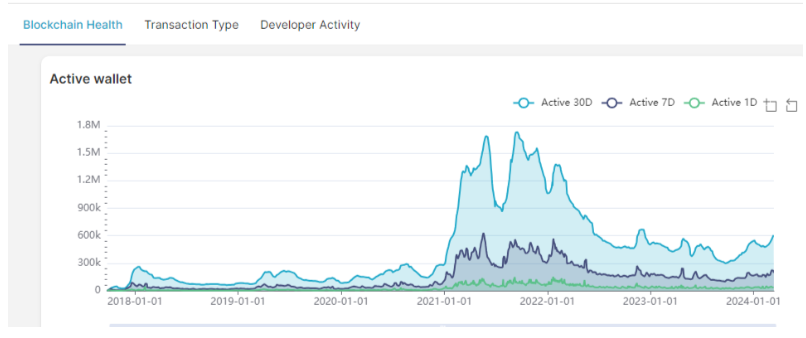
Cardano active wallet address
Total value locked (TVL) on Cardano is also growing steadily, with all of its top 10 protocols recording gains in the last 24 hours. Indigo, MinSwap, and Liqwid lead other protocols on the platform by a mile in terms of TVL.
The recent improvement in network activity also comes at a time when ADA briefly broke the $0.8 resistance on Thursday, sending its treasury past the $1 billion mark, even though these values fell slightly after prices corrected on Friday. Considering the potential impact of USDM's US rollout on the Cardano community, the price increase may suggest a correlation with improved on-chain activity.
However, it's also important to note that the general crypto market rally may be responsible for its price rise rather than network growth.
The Cardano network is also pursuing other strategic partnerships to help boost its price and the growth of its platform. One such initiative includes Dubai's police adoption of Cardano for its blockchain policing project.
ADA has a market capitalization of $24.9 billion as of the time of writing.
Recommended Articles


