
Bitcoin whale moves 50,000 BTC worth $5.4 billion in a day – is volatility ahead?
- A dormant Bitcoin whale moved 50,000 BTC for the first time in 14 years, topping the previous daily high of 3,700 BTC.
- Bitcoin declines below $108,000 after briefly rising above $110,000 on Thursday.
- Exchange volume momentum has dropped to $5.9 billion since early June, indicating a decline in investor interest and a slowdown in network activity.
A transaction made headlines on Friday after a dormant wallet, last active for more than 14 years, transferred 50,000 Bitcoin (BTC) in a single day. The transaction, valued at around $5.4 billion, caught the attention of crypto enthusiasts. It was initiated by a wallet address associated with an early Bitcoin miner.
Meanwhile, Bitcoin’s price continues to extend the pullback during the American session, down nearly 2% and trading at $107,578 at the time of writing. The decline follows an impressive run to $110,530 on Thursday, but the uptrend faltered, reflecting weak market sentiment.
Bitcoin claws back gains as a whale moves 50,000 BTC
According to emerging unverified reports, the Bitcoin miner was sitting on 161,326 BTC linked to the same address. Following the transfer of 50,000 BTC in several batches, the remainder, valued at 120,326 BTC, has yet to be moved 14 years after its accumulation.
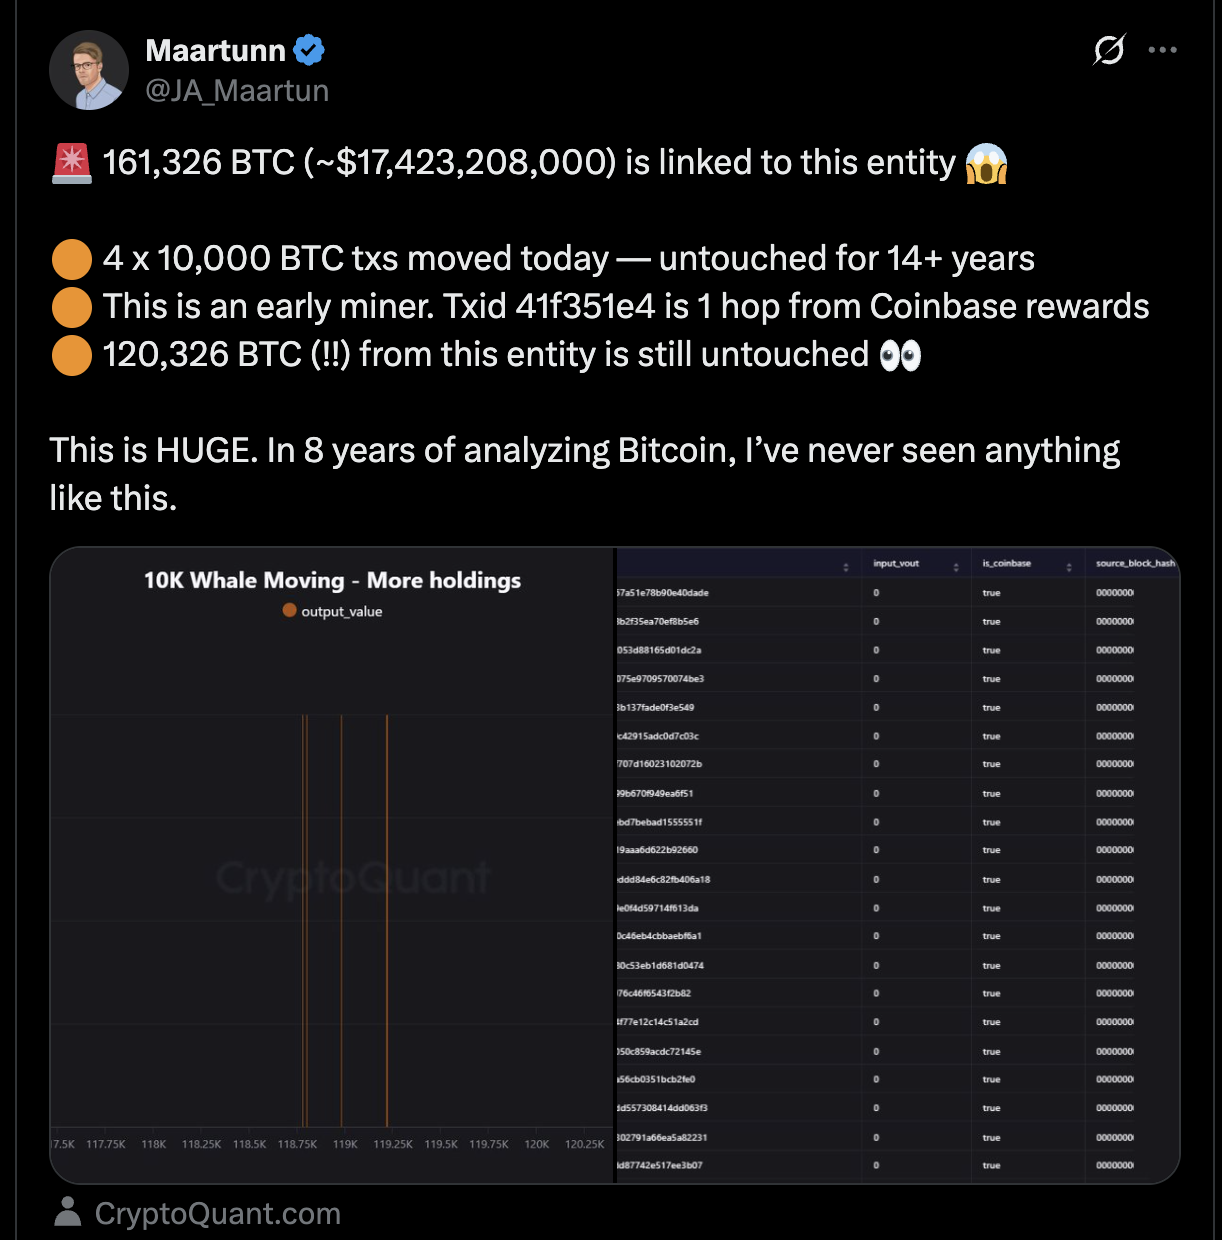
Bitcoin whale transfers | Source: CryptoQuant via X
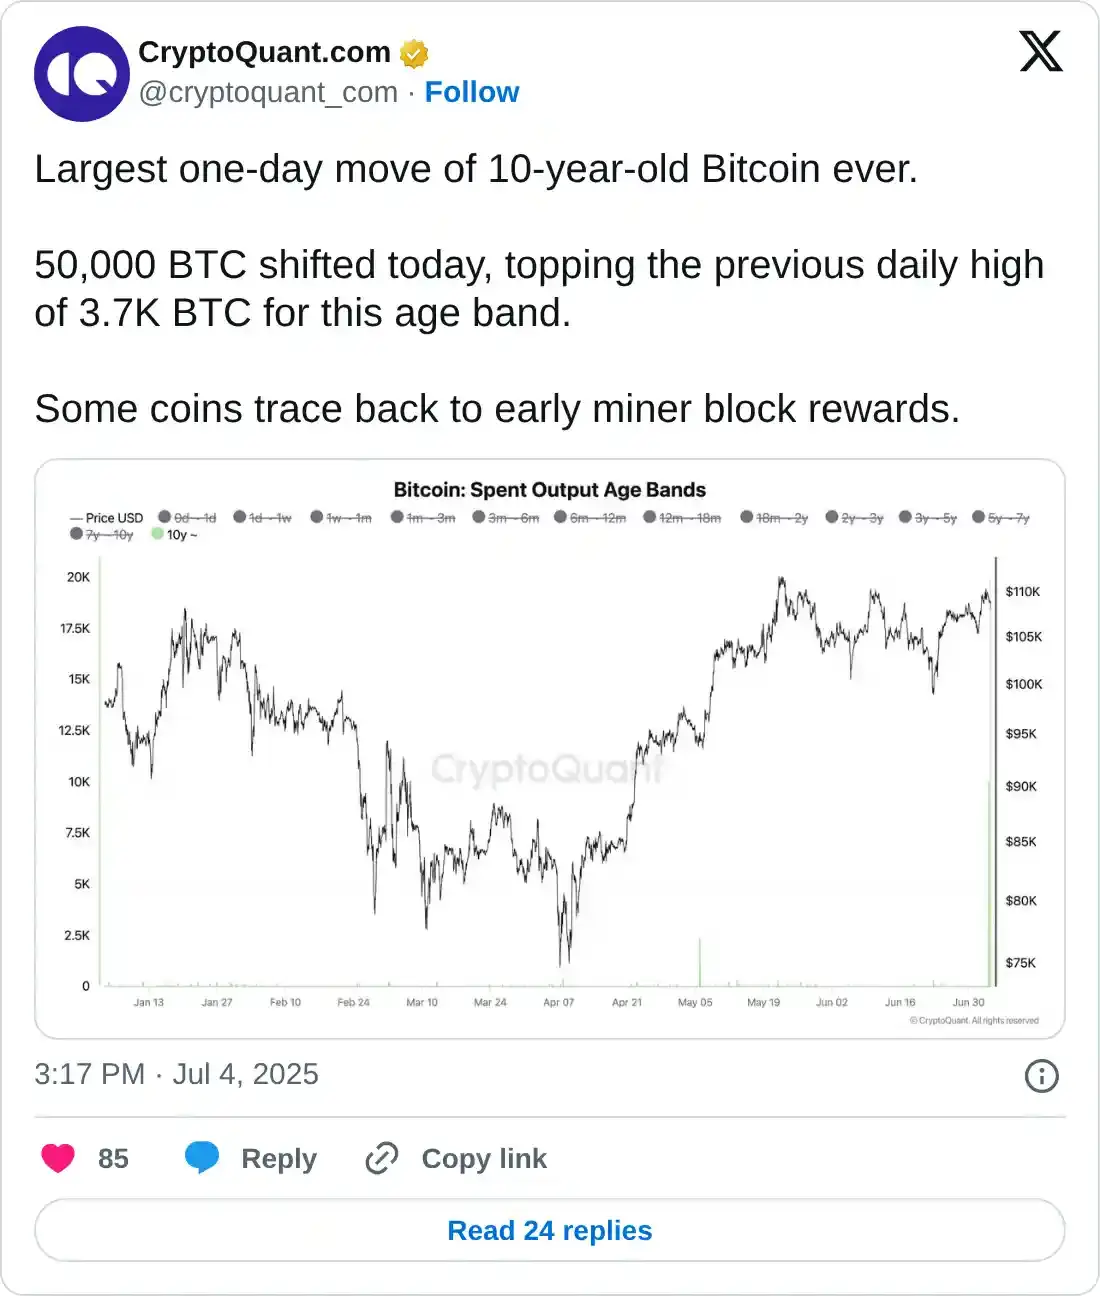
CryptoQuant confirmed that 50,000 BTC had indeed been moved on Friday, surpassing the previous largest single-day transfer of 3,700 BTC. “Some coins trace back to early miner block rewards,” CryptoQuant said.
As the Bitcoin price falters on Friday, volatility could extend the decline into the weekend, especially if investors reduce their exposure, anticipating a further price drop. Uncertainty in the macroeconomic environment remains of deep concern, especially with the 90-day tariff pause announced by United States (US) President Donald Trump approaching on July 9.
The exchange volume momentum has declined since early June, with the monthly average falling to $5.9 billion, according to Glassnode. Despite the drop, the exchange volume is 7% above the annual average of $5.5 billion.
“This modest premium suggests weakening investor interest and slowing network activity despite price consolidation,” Glassnode states.
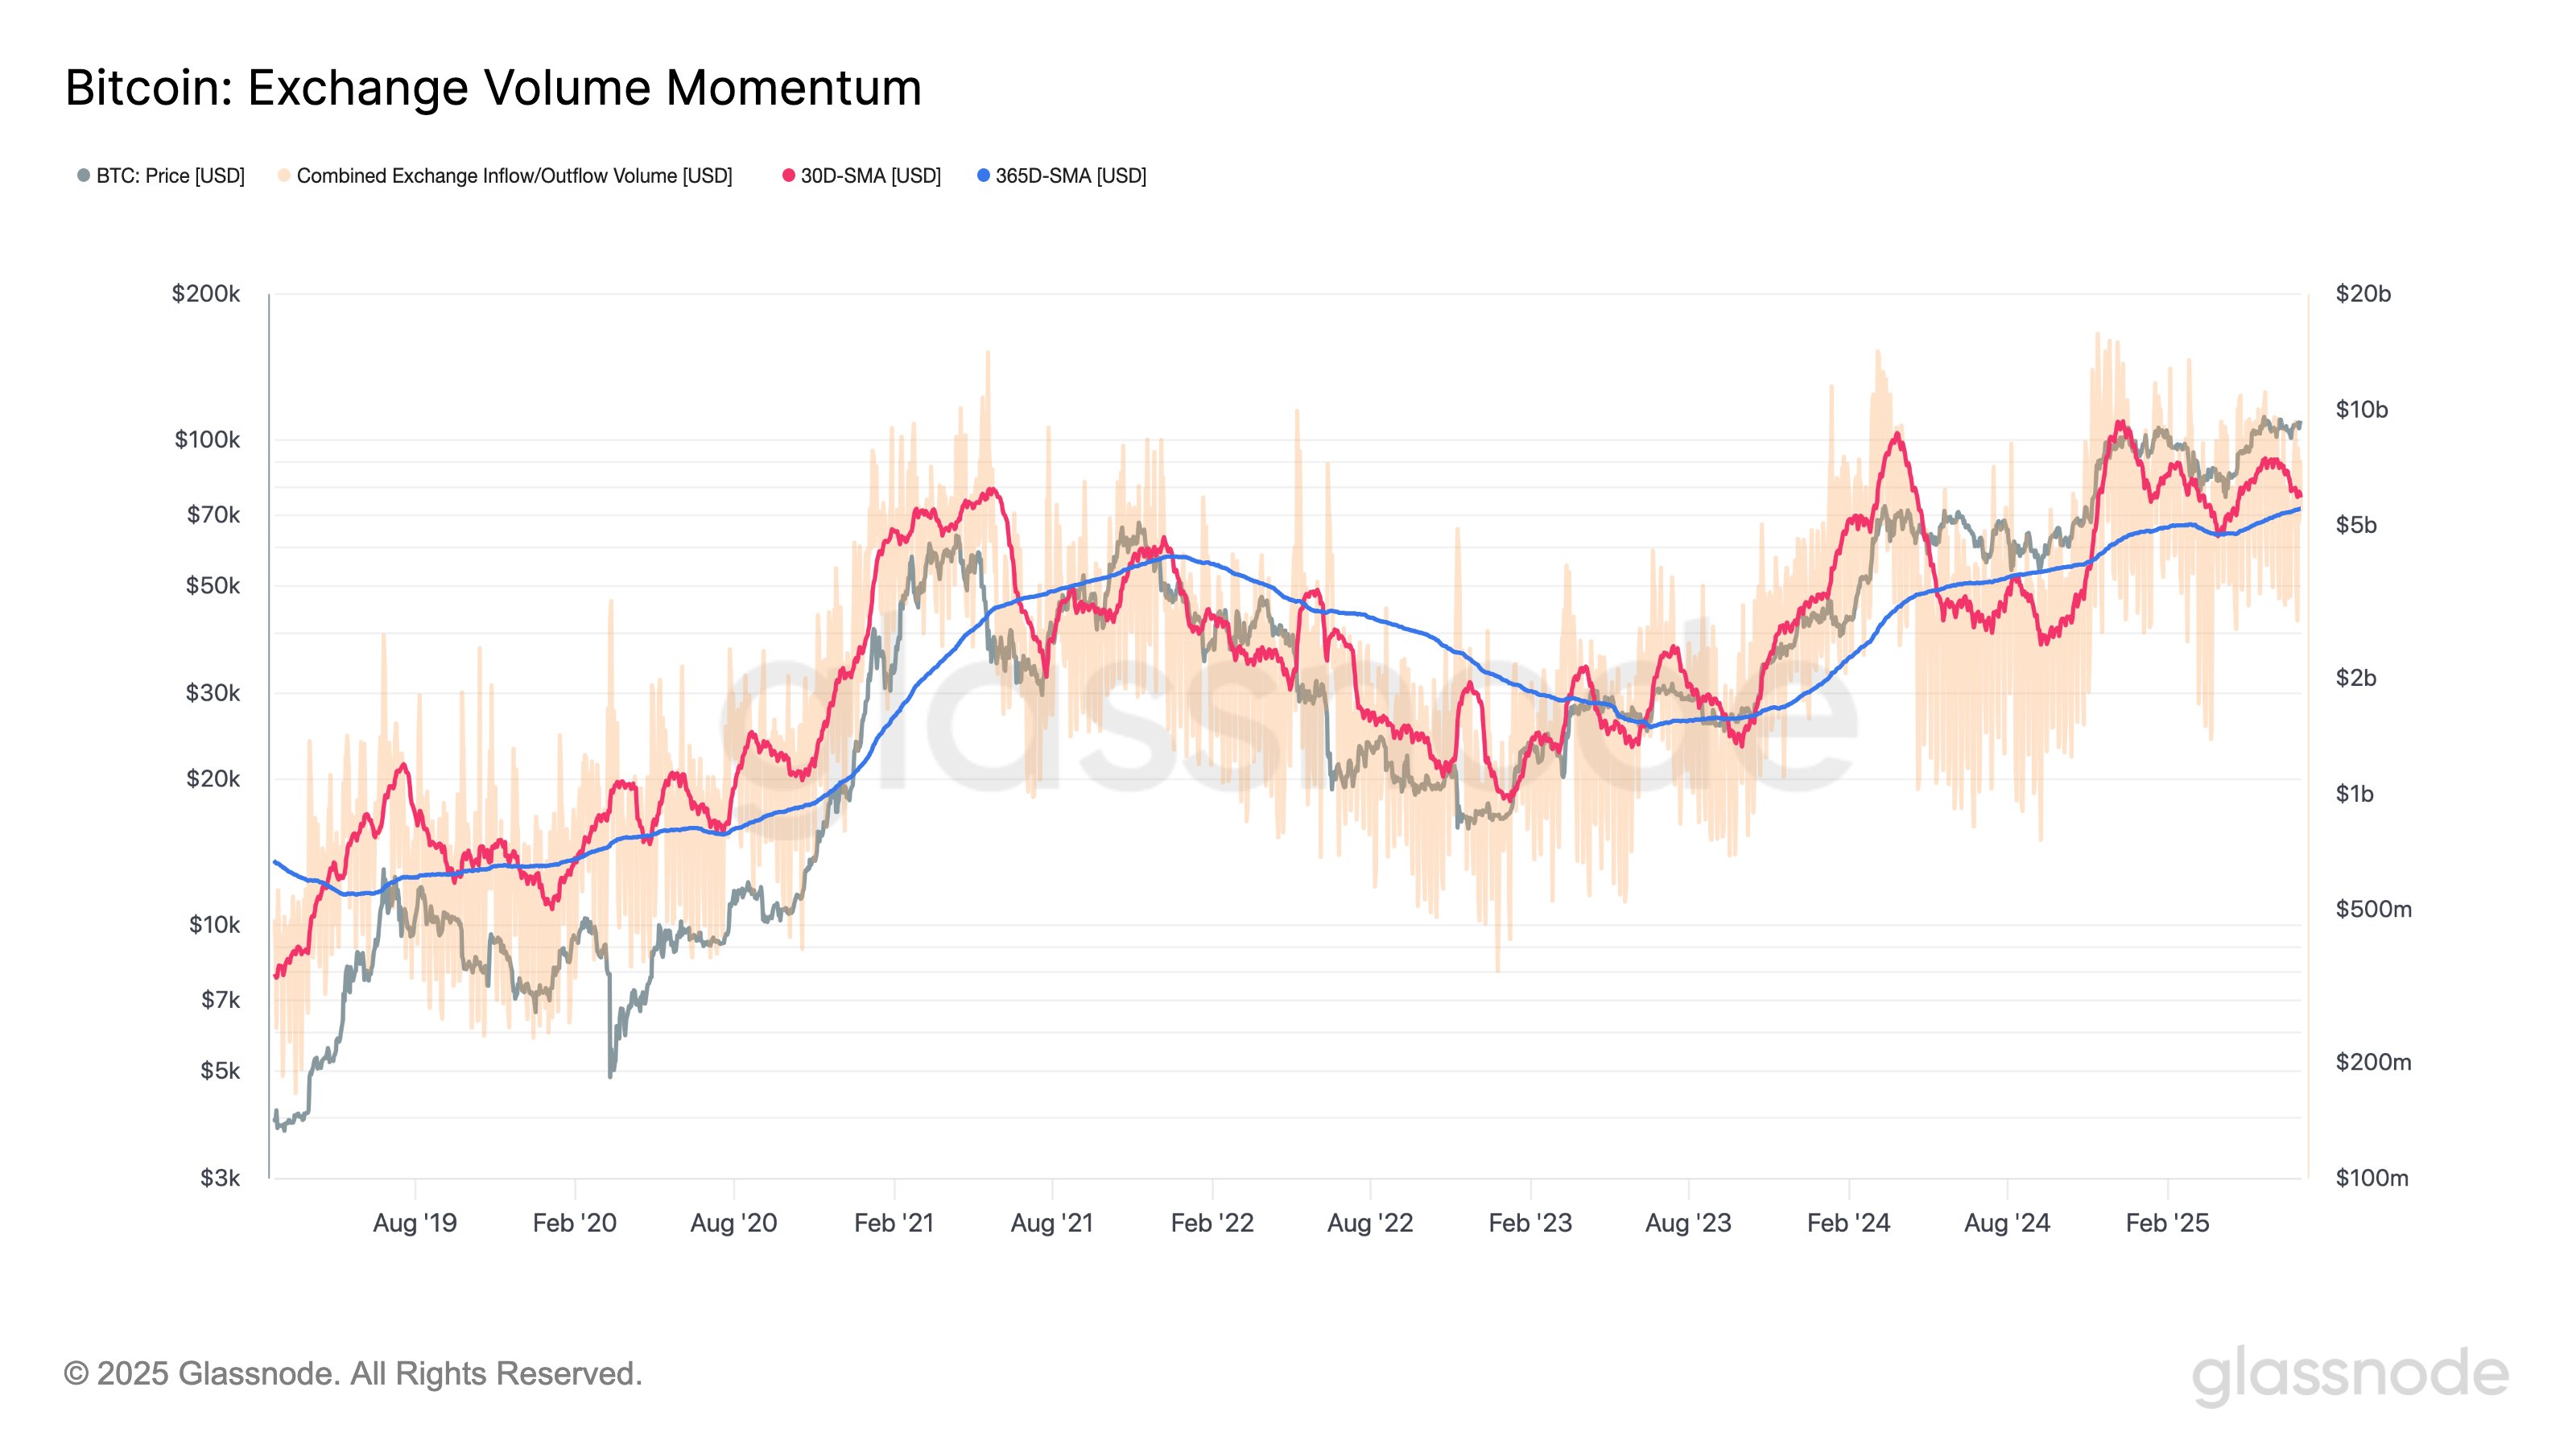
Bitcoin exchange volume momentum | Source| Glassnode
Technical outlook: Can Bitcoin break out to new all-time highs in July?
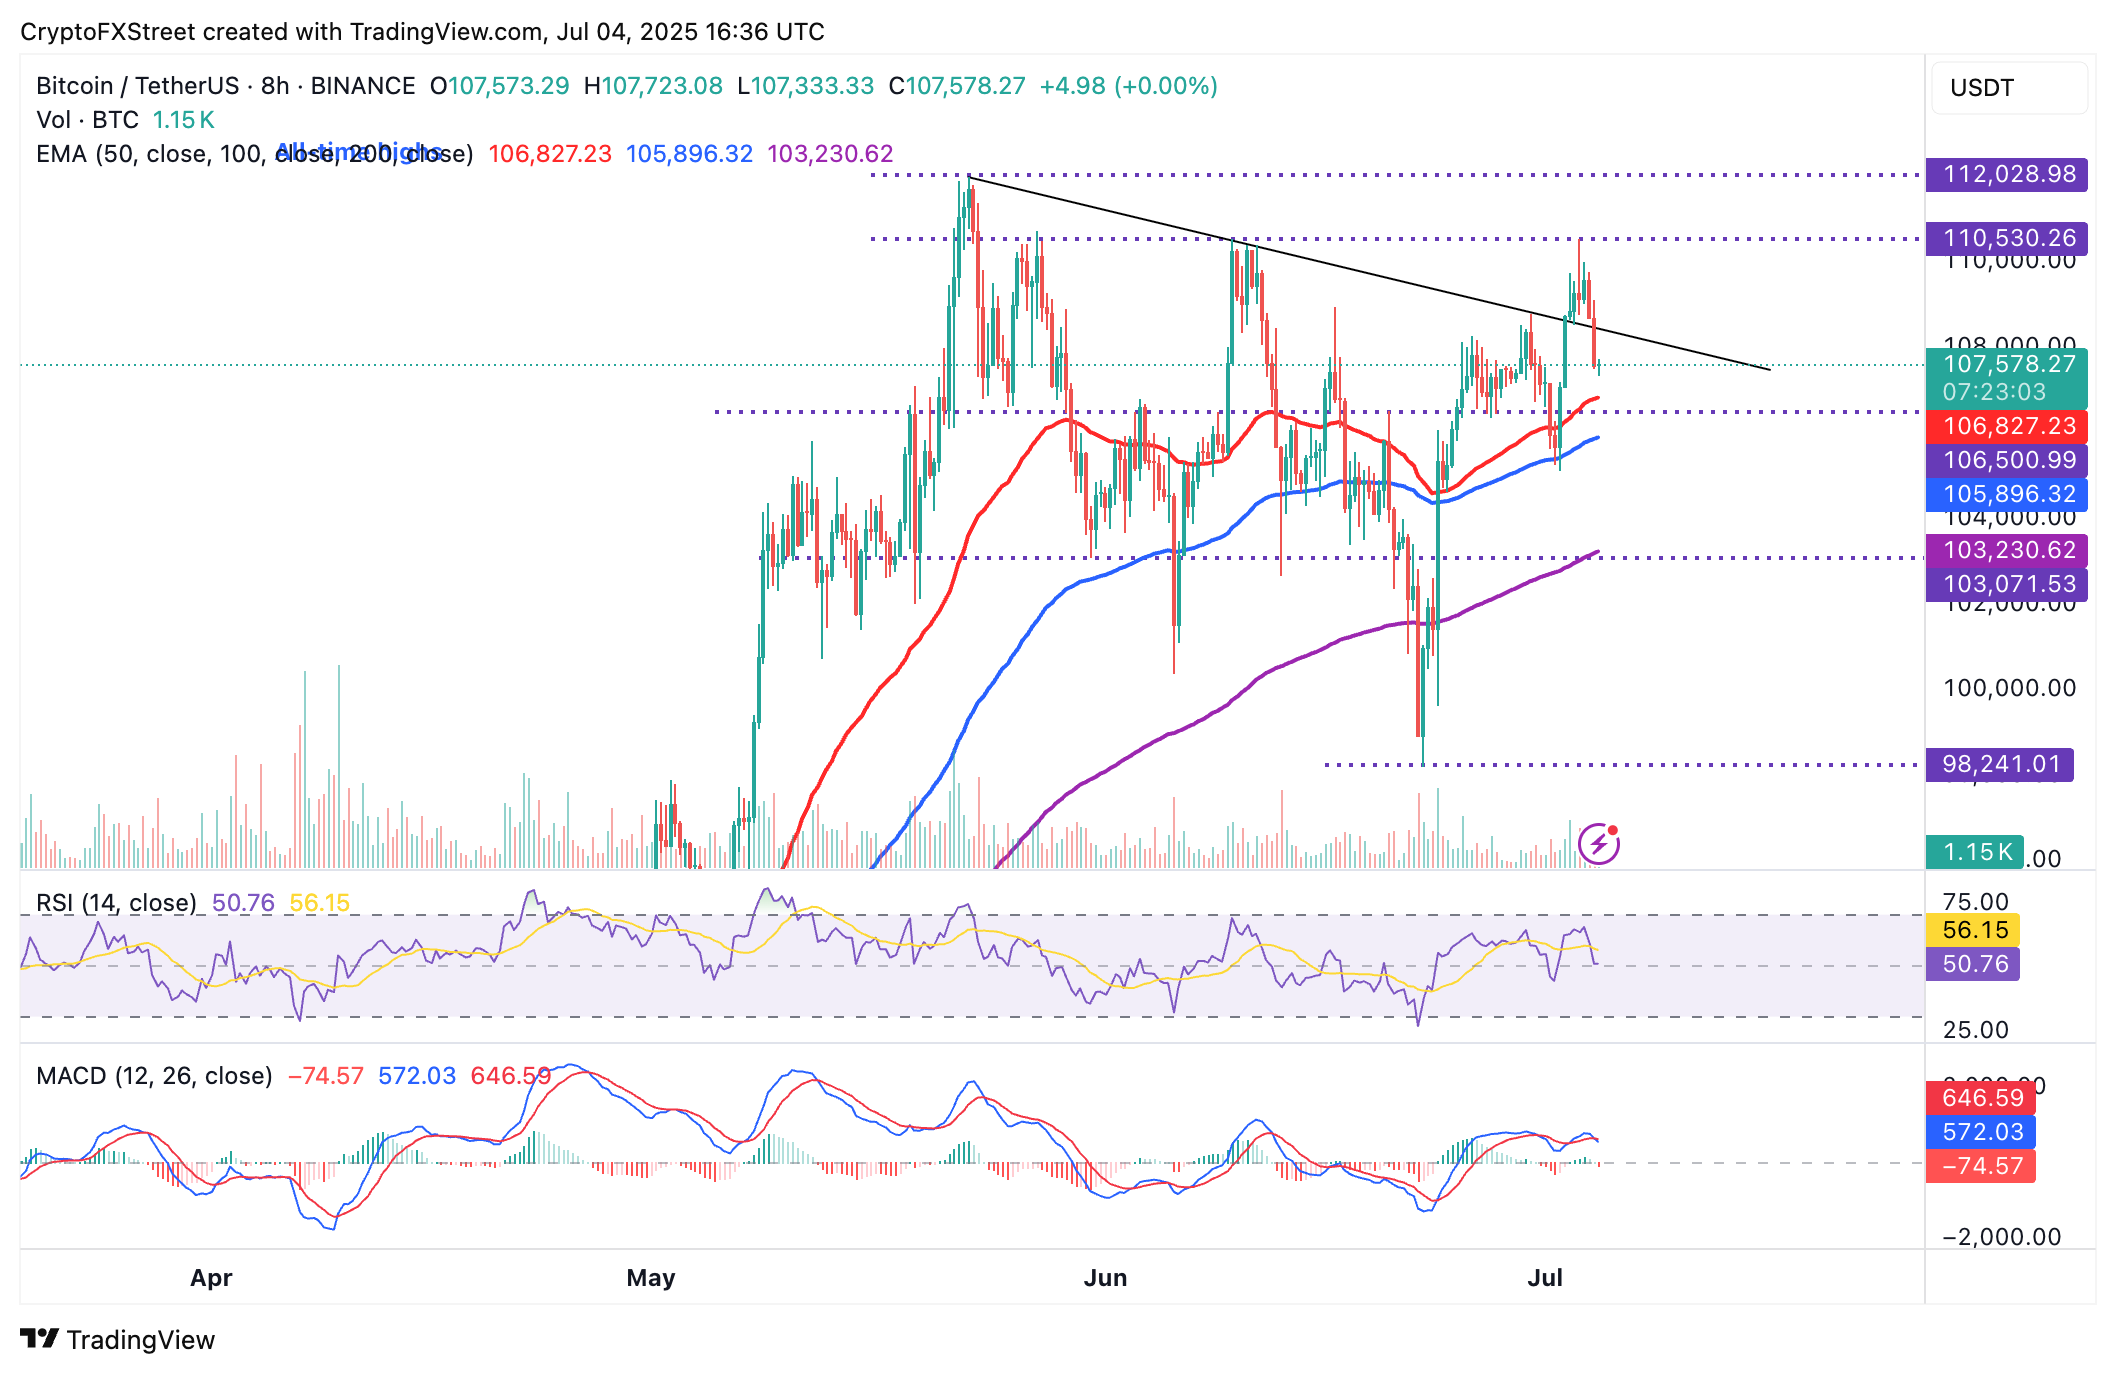
Bitcoin’s price maintains a technical bearish bias, having broken below the same descending trendline it had stepped above on Thursday, as observed on the 8-hour chart below.
Based on the Moving Average Convergence Divergence (MACD) indicator, which has recently confirmed a sell signal, the pullback could extend into the weekend.
The 50-period Exponential Moving Average (EMA) at $106,827 and the 100-period EMA at $105,896 are in line to absorb overhead pressure should the decline accelerate.
BTC/USD daily chart
On the other hand, an immediate trend reversal cannot be ruled out yet, especially with steady demand from institutional investors through BTC spot Exchange Traded Funds (ETFs) and Bitcoin treasuries.
Cryptocurrency metrics FAQs
The developer or creator of each cryptocurrency decides on the total number of tokens that can be minted or issued. Only a certain number of these assets can be minted by mining, staking or other mechanisms. This is defined by the algorithm of the underlying blockchain technology. On the other hand, circulating supply can also be decreased via actions such as burning tokens, or mistakenly sending assets to addresses of other incompatible blockchains.
Market capitalization is the result of multiplying the circulating supply of a certain asset by the asset’s current market value.
Trading volume refers to the total number of tokens for a specific asset that has been transacted or exchanged between buyers and sellers within set trading hours, for example, 24 hours. It is used to gauge market sentiment, this metric combines all volumes on centralized exchanges and decentralized exchanges. Increasing trading volume often denotes the demand for a certain asset as more people are buying and selling the cryptocurrency.
Funding rates are a concept designed to encourage traders to take positions and ensure perpetual contract prices match spot markets. It defines a mechanism by exchanges to ensure that future prices and index prices periodic payments regularly converge. When the funding rate is positive, the price of the perpetual contract is higher than the mark price. This means traders who are bullish and have opened long positions pay traders who are in short positions. On the other hand, a negative funding rate means perpetual prices are below the mark price, and hence traders with short positions pay traders who have opened long positions.
Recommended Articles


