

Top Crypto Movers: KAIA, ENS, CRV - Altcoins plummet ahead of GENIUS Act, Kaia stands out
- Kaia extends gains with Won-pegged stablecoin assurance, the sole crypto with double-digit gains in the last 24 hours.
- Ethereum Naming Service leads the market decline as it reverses from a strong supply zone.
- Curve DAO risks a pullback to the $0.50 support after an 8% drop was recorded on Wednesday.
The cryptocurrency market experienced a sharp pullback on Wednesday, with Bitcoin (BTC) closing below $109,000. Top altcoins, including Ethereum (ETH), Ripple’s XRP (XRP), Solana (SOL), and Dogecoin (DOGE), have recorded a nearly 2% drop. The sudden blow aligns with the US Senate voting in favor of invoking cloture on the GENIUS Act by a 68-30 margin.
Amid market weakness, Ethereum Naming Service (ENS) and Curve DAO (CRV) led the bearish trend, experiencing a pullback of over 8% in the last 24 hours. Kaia (KAIA) rising against the bearish tide extends the gains by over 17% on Wednesday.
Kaia’s recovery hits four-month high
KAIA token edges higher by over 2% on Thursday at press time, while the short-term market inclination remains bearish. The altcoin rally continues after Kaia’s chairman announced plans to onboard a Korean Won-pegged stablecoin on the platform.
KAIA is up by over 60% so far this week, crossing above the 23.6% Fibonacci level at $0.1635, retraced from the highest closing price at $0.4012 to the all-time low at $0.0901.
A boost in trading volume supports the trend reversal alongside the Moving Average Convergence/Divergence (MACD) indicator signaling a bullish crossover with its signal line.
The $0.1912 level, last tested on January 31, acts as the immediate resistance for KAIA, followed by the 50% Fibonacci level at $0.2457.
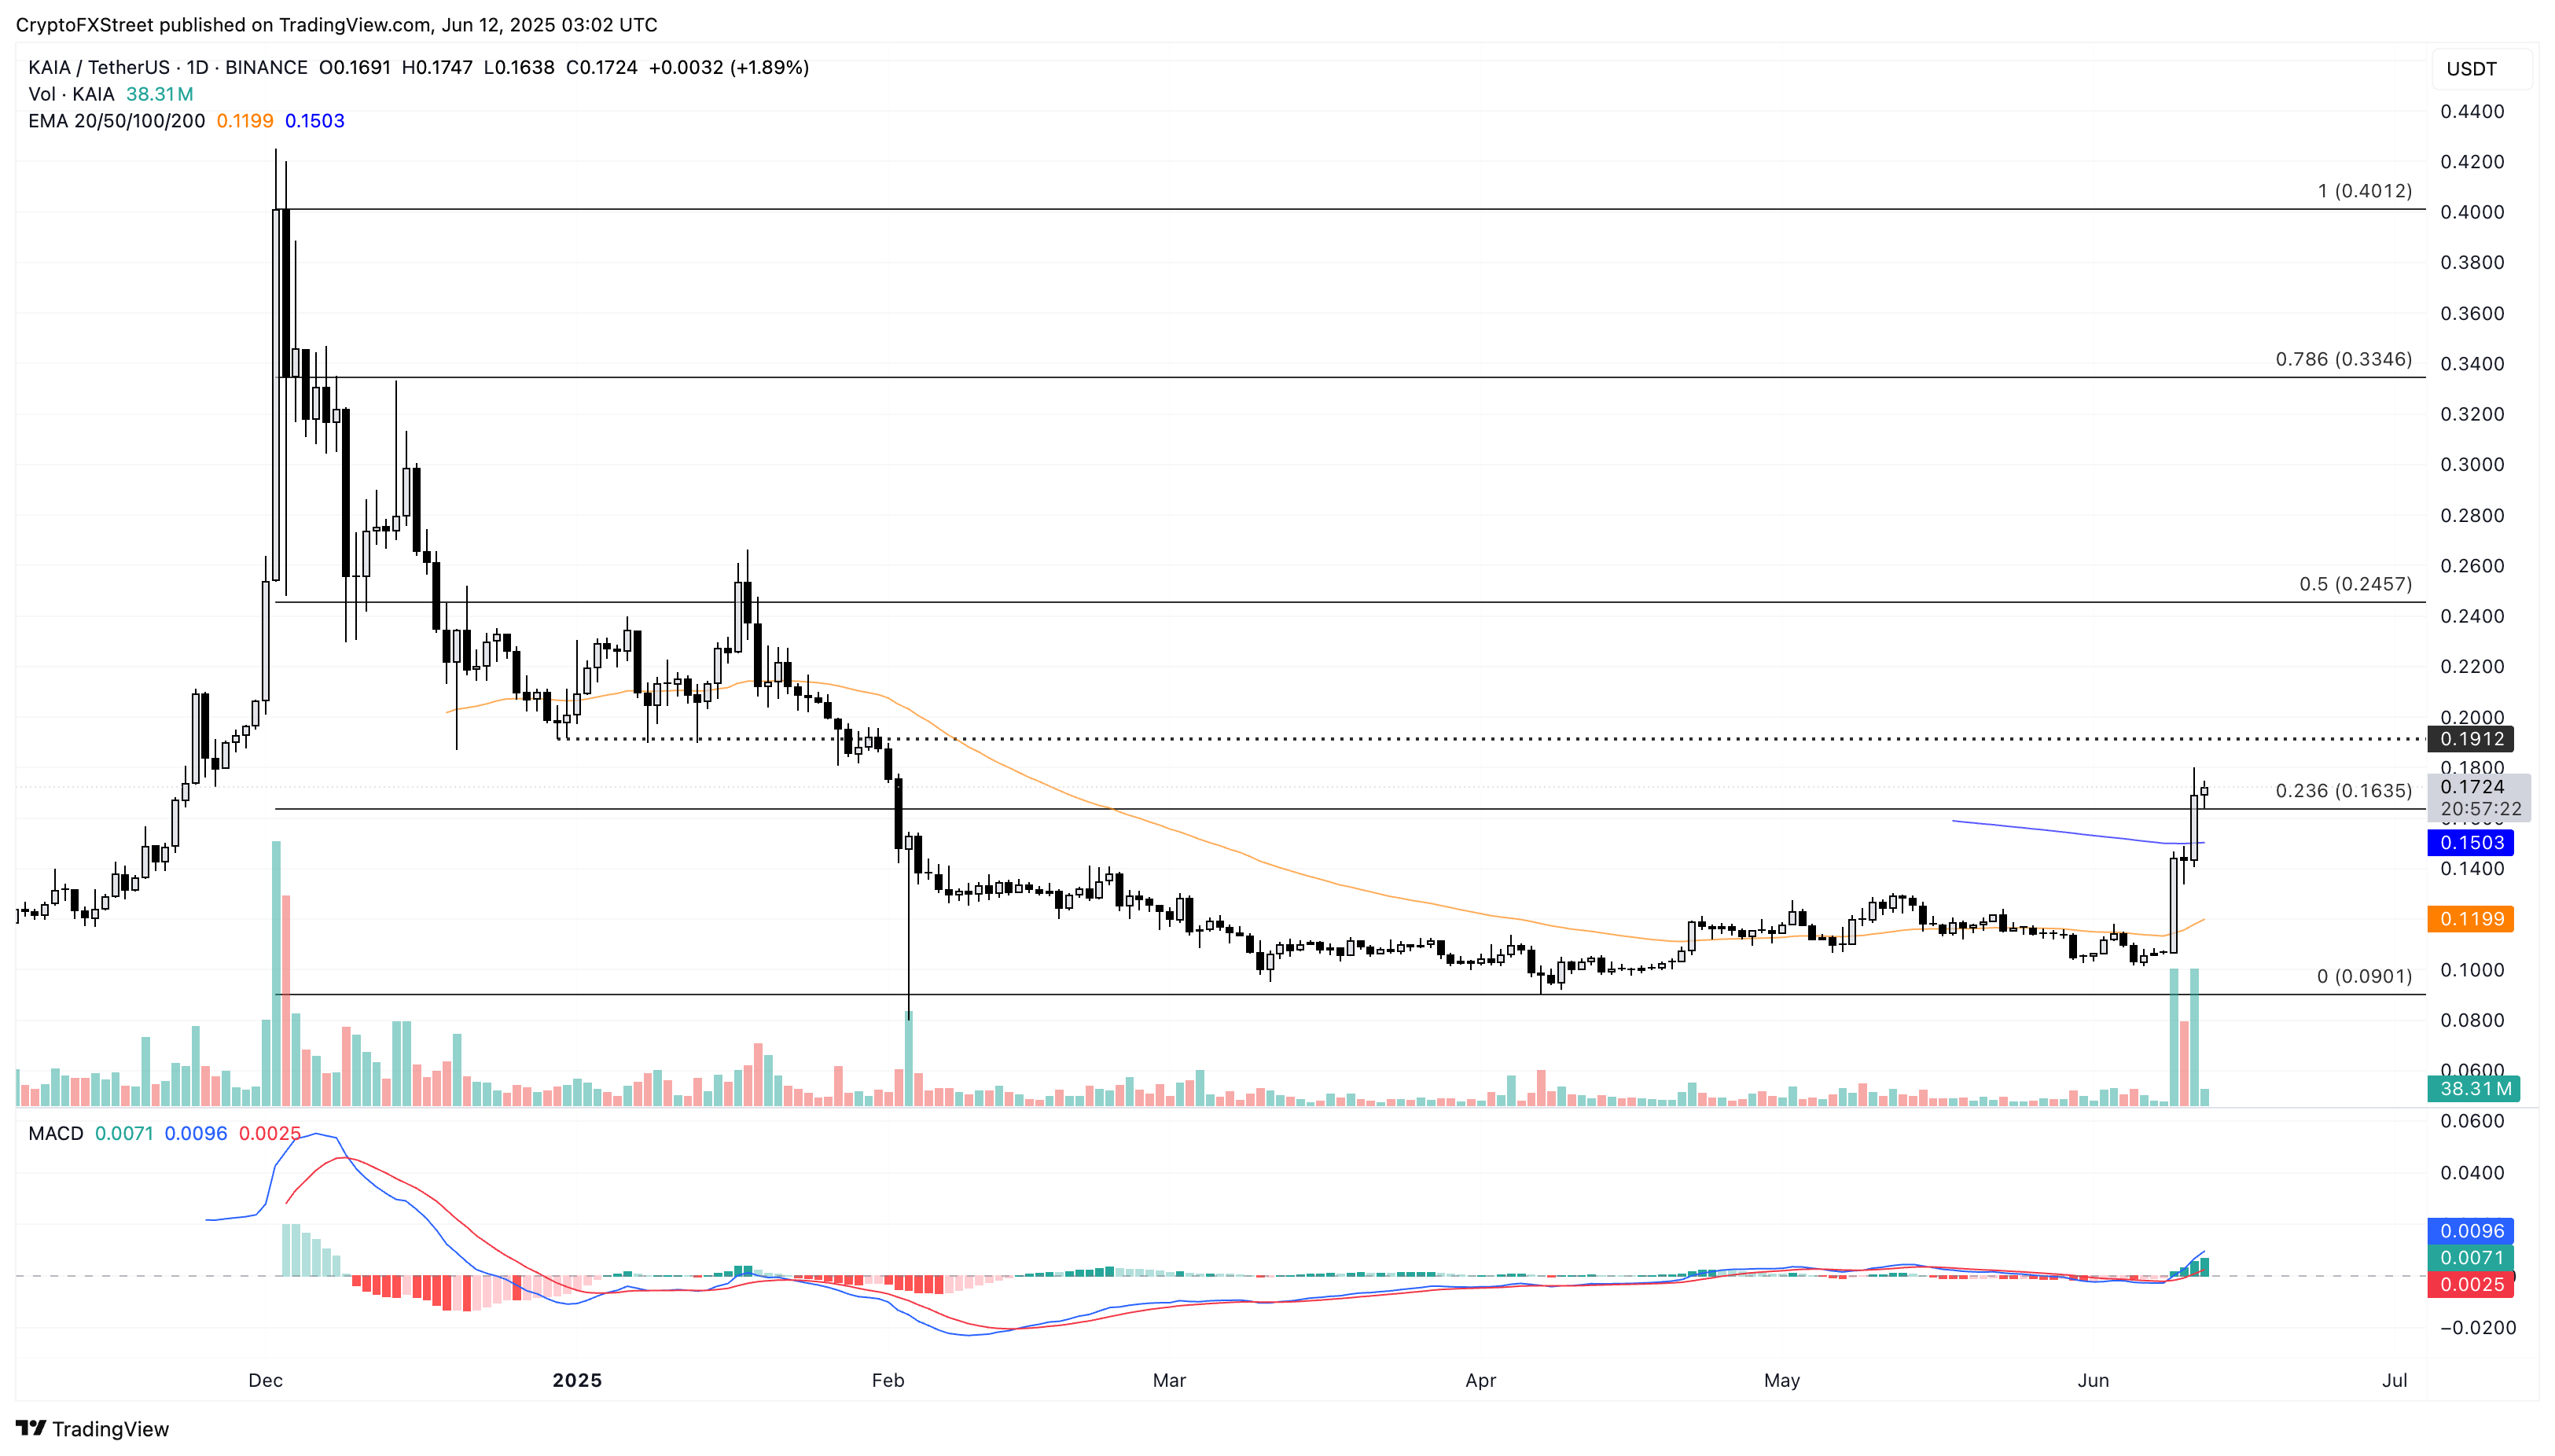
KAIA/USDT daily price chart.
However, a reversal under the 23.6% Fibonacci level could retest the 200-day Exponential Moving Average (EMA) at $0.1503.
Ethereum Naming Service is in a free fall
The ENS token dropped by almost 5% on Wednesday after failing to overcome the overhead selling pressure at the $25 supply zone. At the time of writing, ENS trades at $22.43, holding ground above the 200-day EMA at $21.92.
The price action reveals a falling wedge breakout in the daily chart (shared below) while the recent correction prolongs the sideways trend below $25. The path of least resistance with the newly formed bearish candle indicates a steep correction towards the $20 demand zone.
However, the technical indicator projects an optimistic outlook with the MACD and its signal line recording a bullish crossover. Further up, the rising 50-day EMA hints at a golden cross with the 200-day EMA.
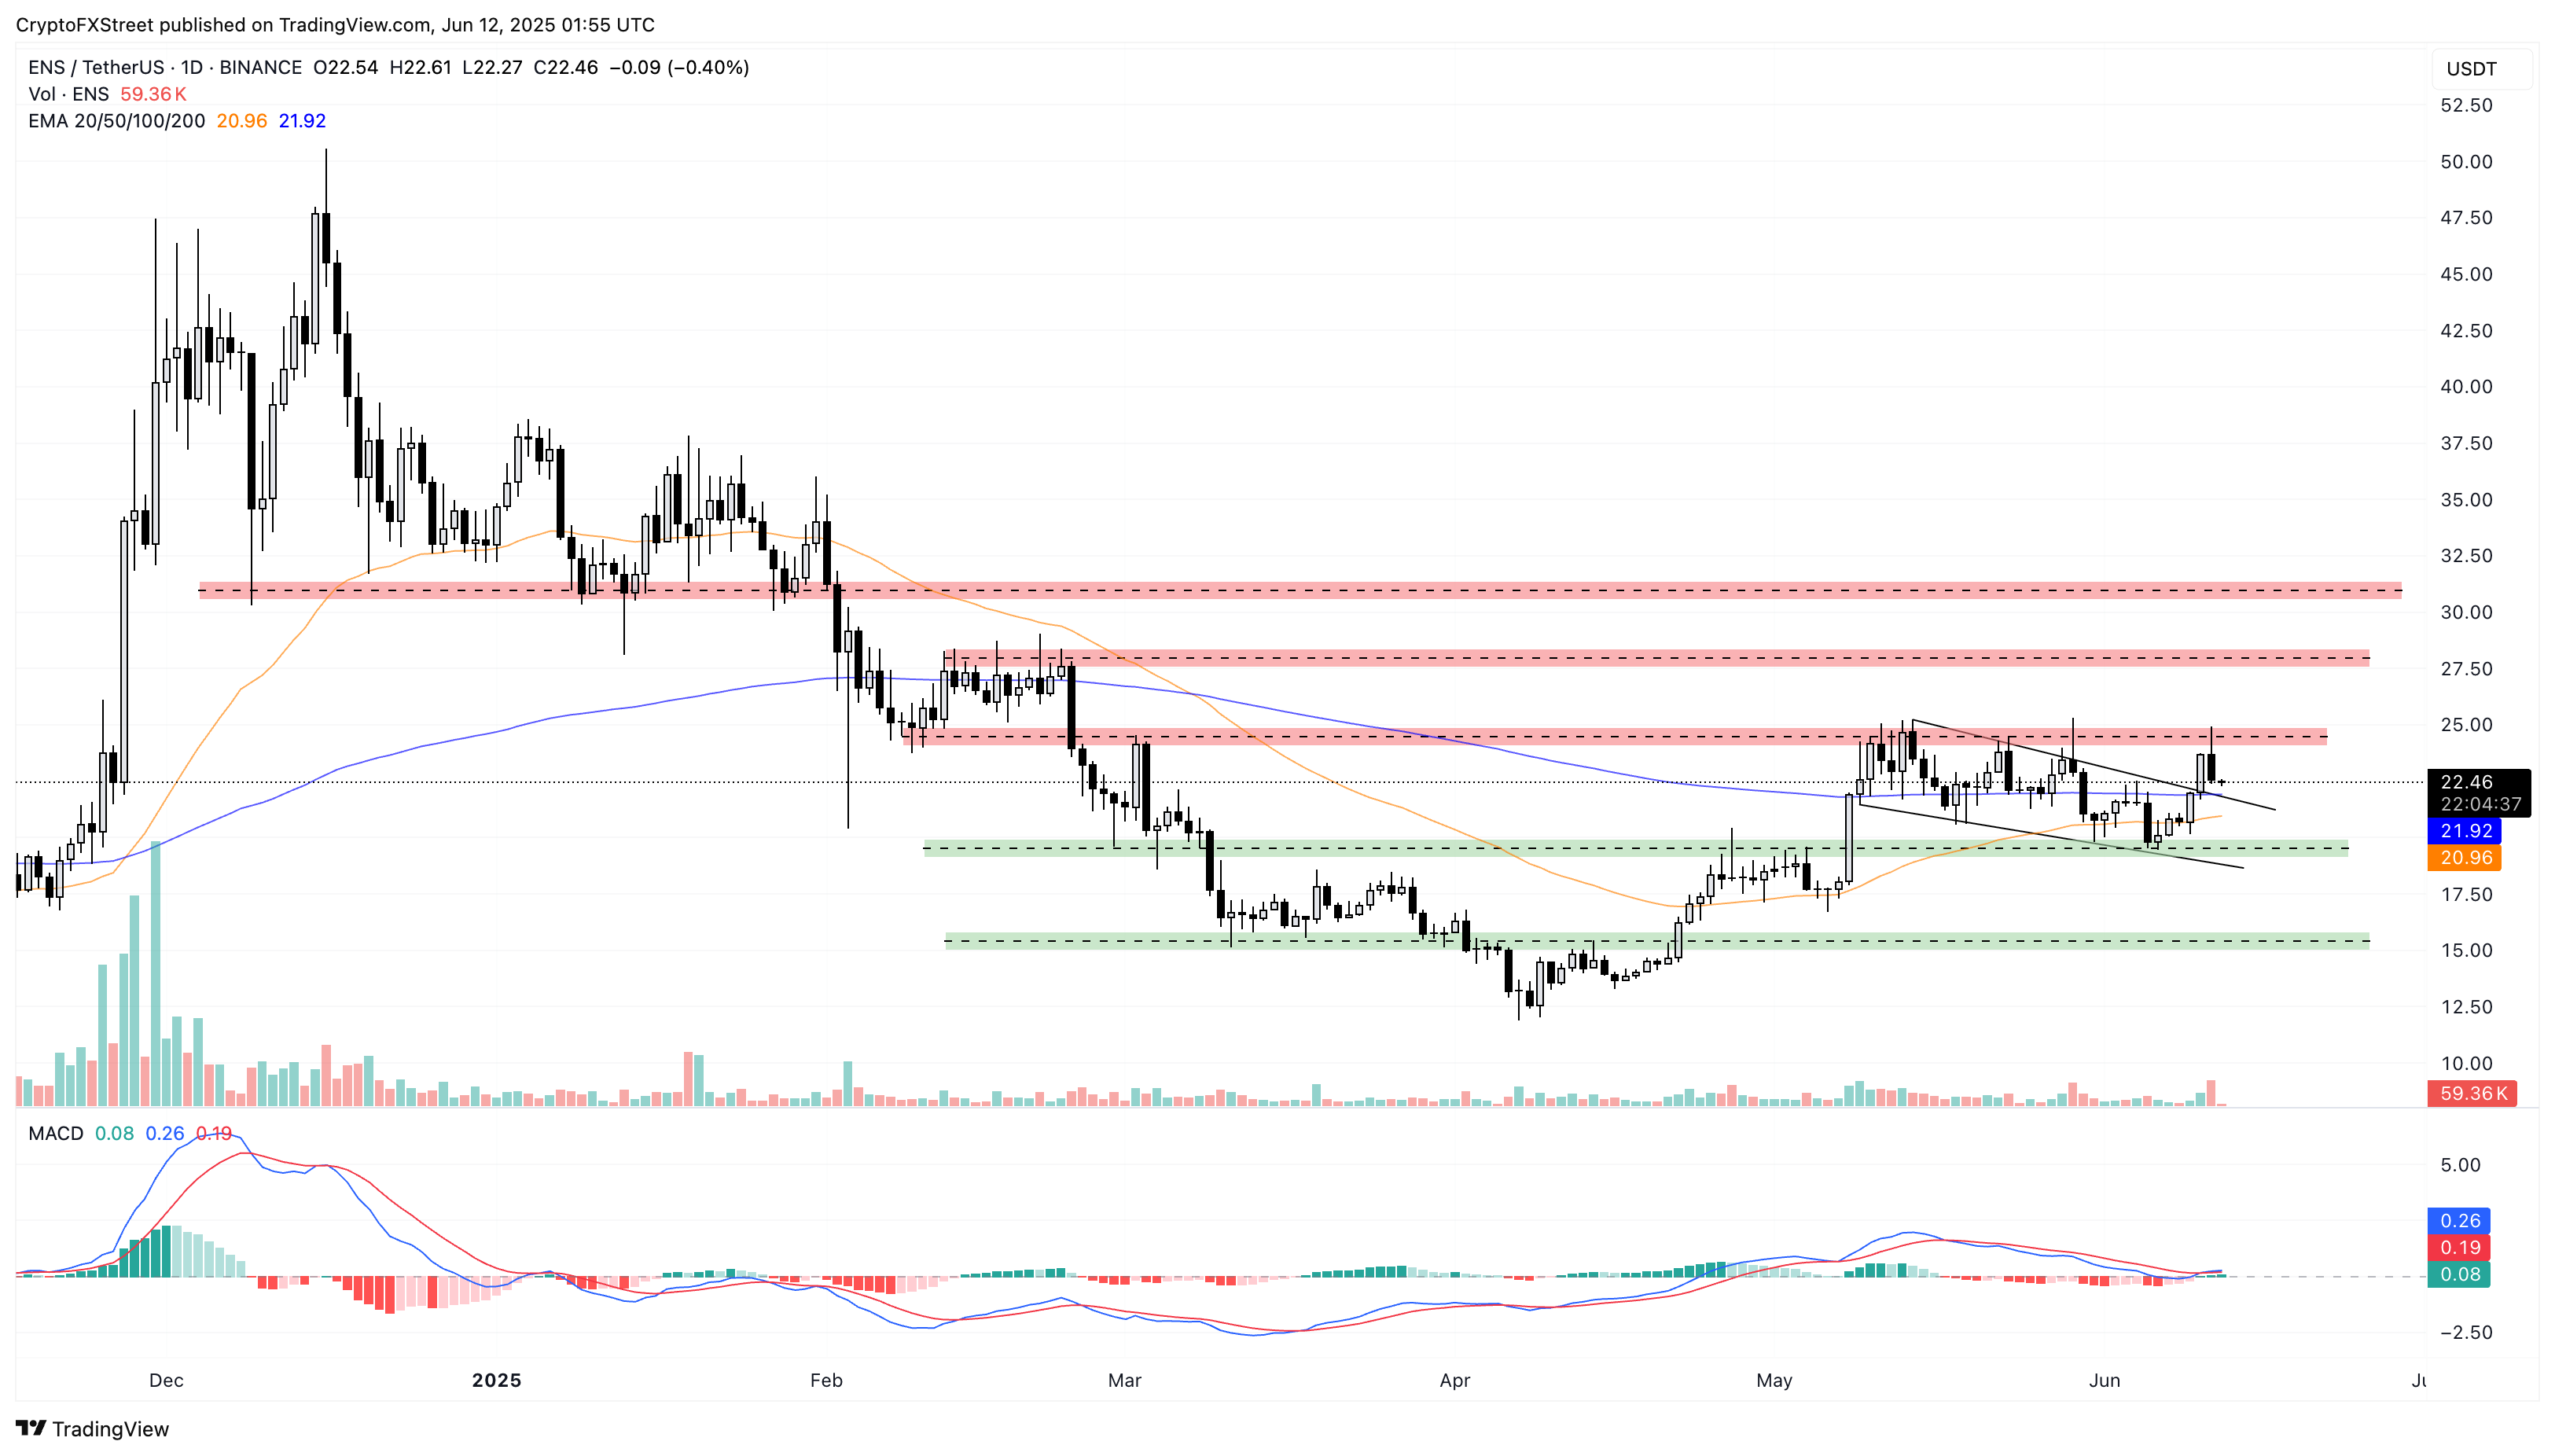
ENS/USDT daily price chart.
If a post-retest reversal in ENS occurs, resulting in a clean push above $25, investors could target the $28 zone.
Curve DAO moves downhill, targets 200-day EMA
CRV forms a bearish engulfing candle with a sudden 8.56% plunge on Wednesday. At the time of writing, CRV extends the losses by over 2% and trades at $0.6584.
Declining below the 50-day EMA, the least resistance pathway targets the 200-day EMA at $0.6137. A closing below the dynamic support could catalyze a pullback to the $0.50 psychological support.
The MACD indicator turns flat after the recent bullish crossover with its signal line due to heightened selling pressure. As it reflects uncertainty in the short term, an extended price drop might restart a bearish trend in the MACD and its signal lines.
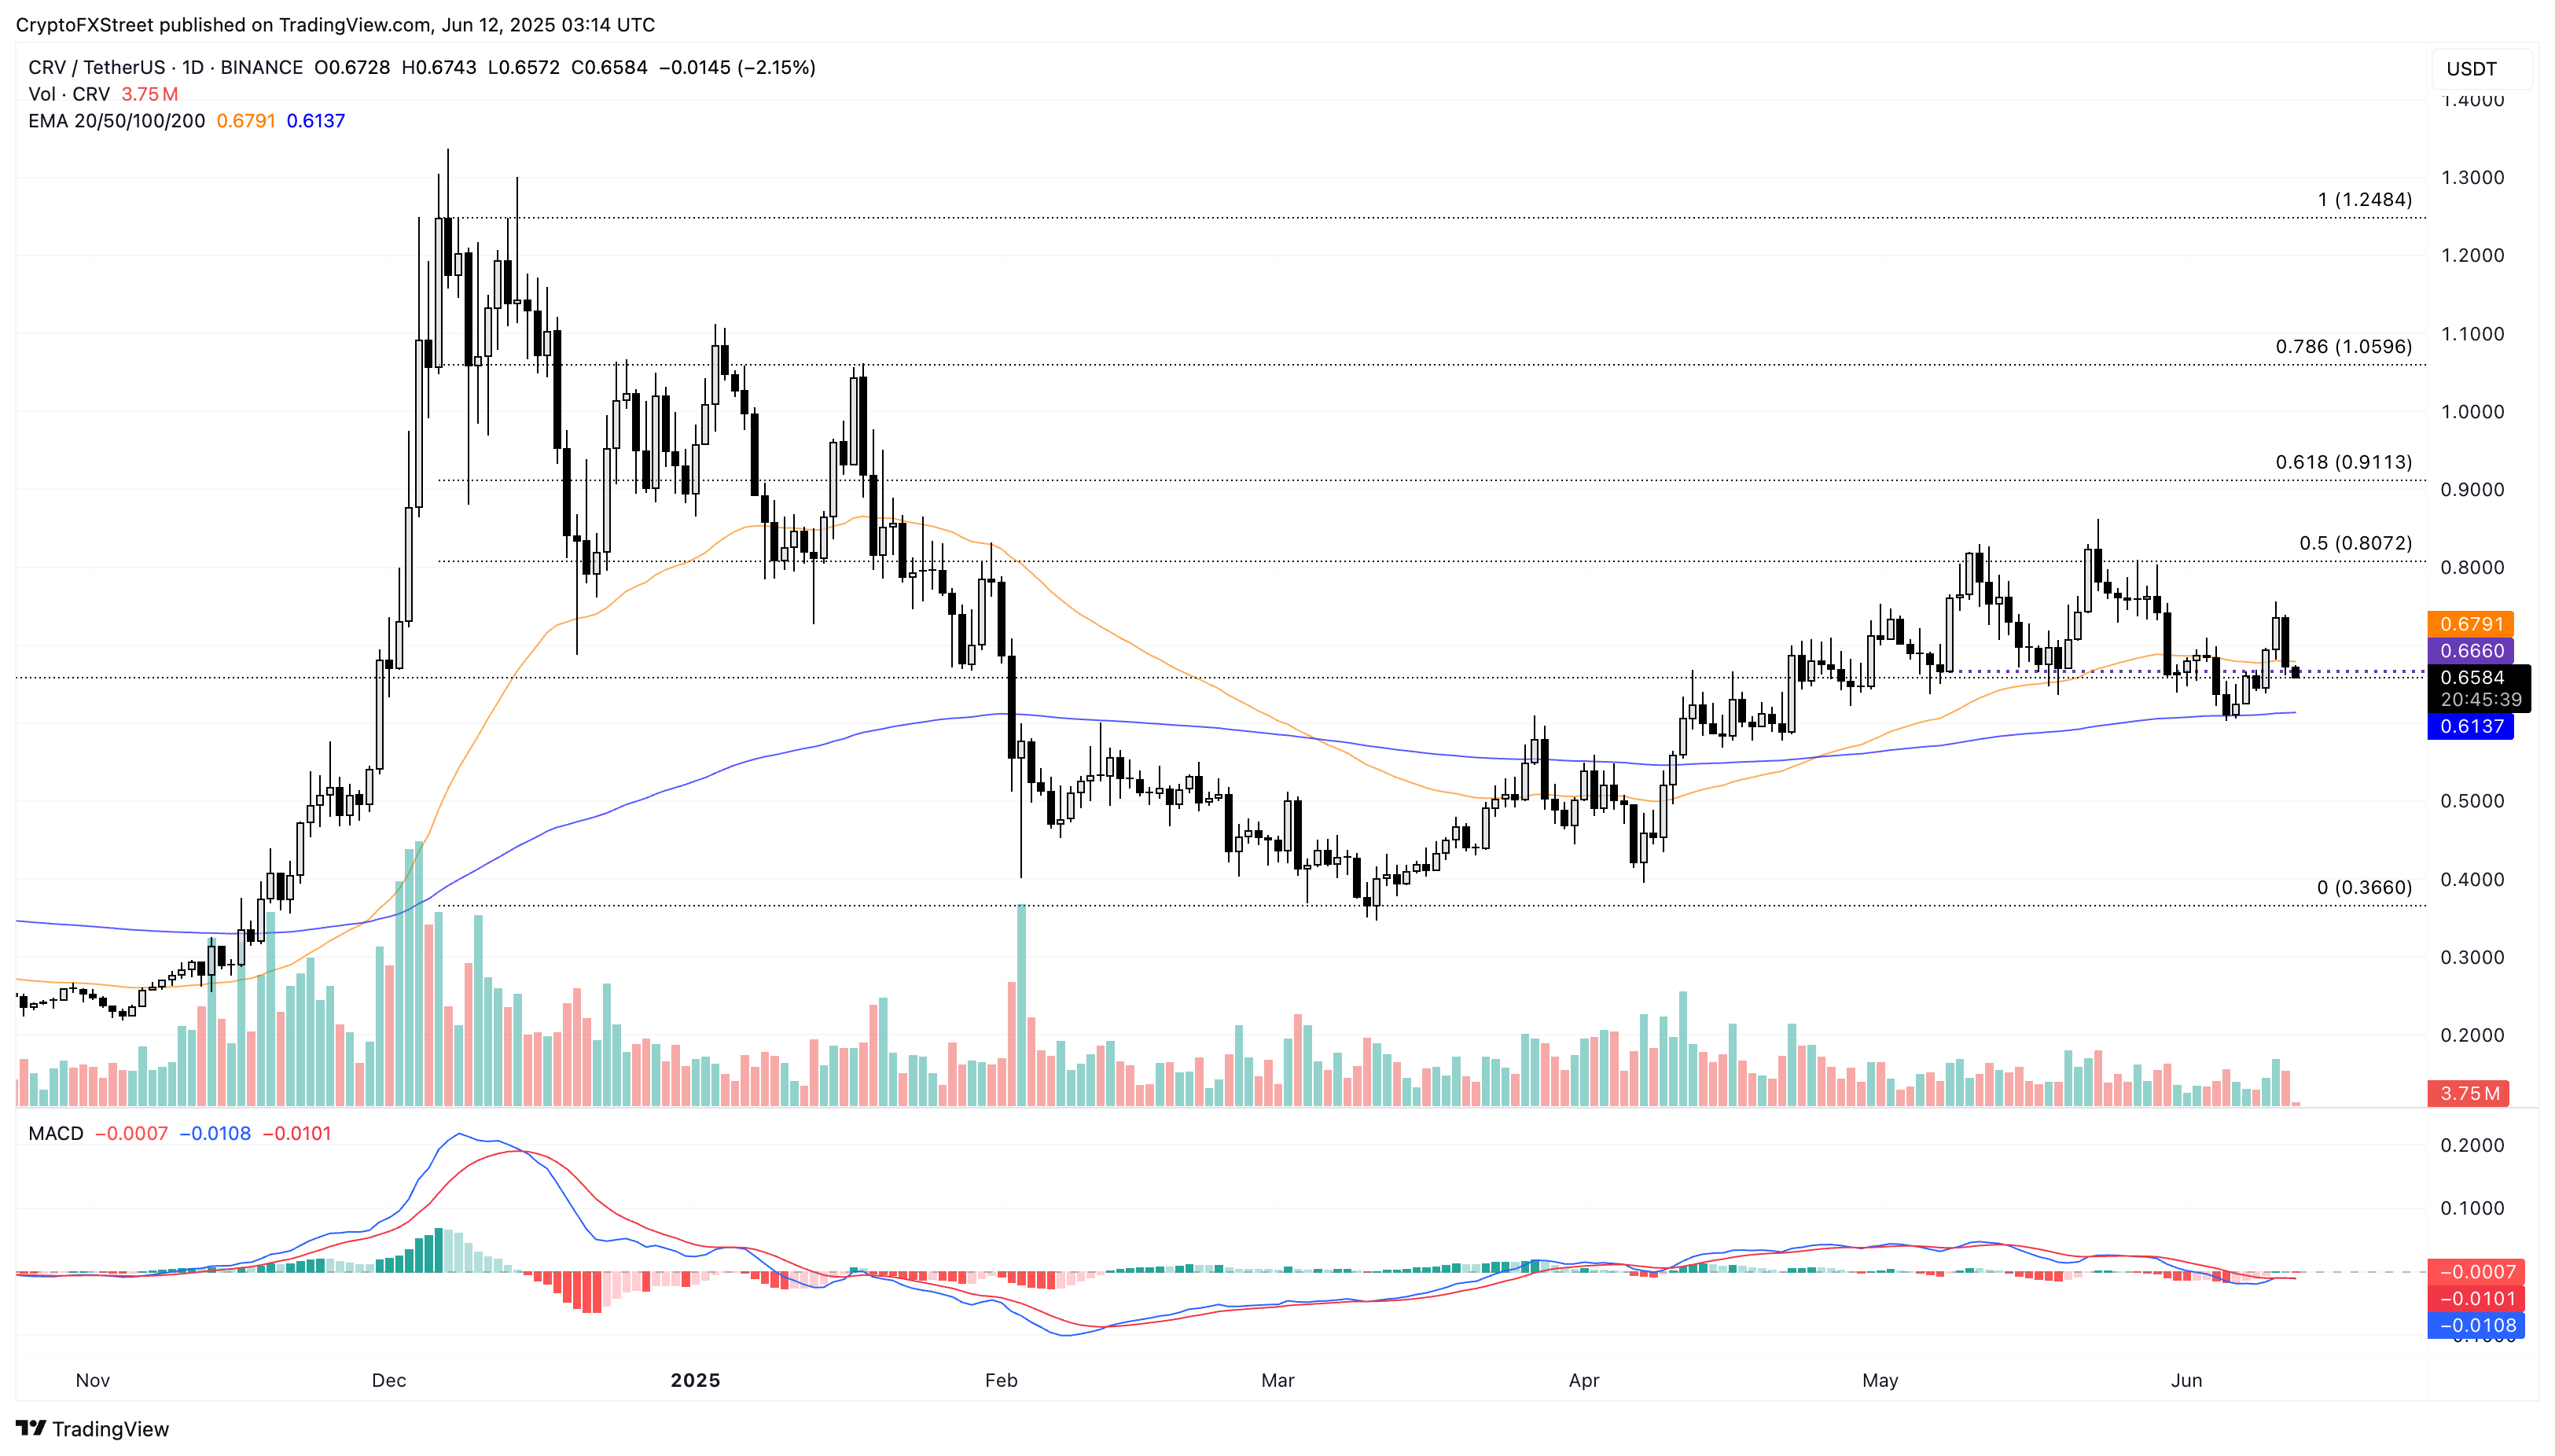
CRV/USDT daily price chart.
Investors waiting for a bullish reversal could find a closing above the opening price of the recently formed bearish engulfing candle at $0.7358 as an entry opportunity. A bullish target remains at the $0.8072 mark, aligning with the 50% retracement level, drawn from the highest 52-week closing at $1.2484 and the lowest year-to-date closing at $0.3660.
Recommended Articles


