

This is how one Ethereum hard fork in 2023 changed the DeFi market forever
- Liquid Staking protocols ended the reign of Decentralized Exchanges (DEX), taking the spot of the second-biggest protocol after Lending.
- Liquid Staking still single-handedly eclipsed Lending as Lido DAO surpassed the TVL of AAVE and JustLend.
- Additionally, when it comes to growth, Liquid Staking outperformed Lending, increasing by 334% and 176%, respectively.
With the year coming to an end, the DeFi market is also locking in the changes witnessed throughout 2023. One key change was the Ethereum Shapella hard fork that not only impacted the market but seemingly altered the face of the Decentralized (DeFi) market entirely.
Ethereum Shapella hard fork
Ethereum mainnet went through the Shanghai hard fork earlier this year in April, which enabled the option to withdraw the ETH staked by validators. This occasion was expected to be a hugely bearish event as the crypto market feared that the investors might choose to pull out their staked ETH.
However, following the hard fork, the opposite happened as more money started pouring into staking protocols. With the option and safety of withdrawing their assets at any time, investors went in deep with staking, the result of which could be seen on the DeFi market.
The category of Liquid Staking protocols witnessed an increase starting in March, and by the end of June, it surpassed the Decentralized Exchanges (DEX) category. DEXes reigned as the second biggest protocol category since 2021, which came to an end.
Since the beginning of 2023, the total value locked (TVL) in Liquid Staking protocols increased by 334%, which is nearly twice the 176% growth witnessed by DEXes in the same period. Today, the former holds over $32 billion in TVL, while the latter contributes $21 billion to the DeFi market.
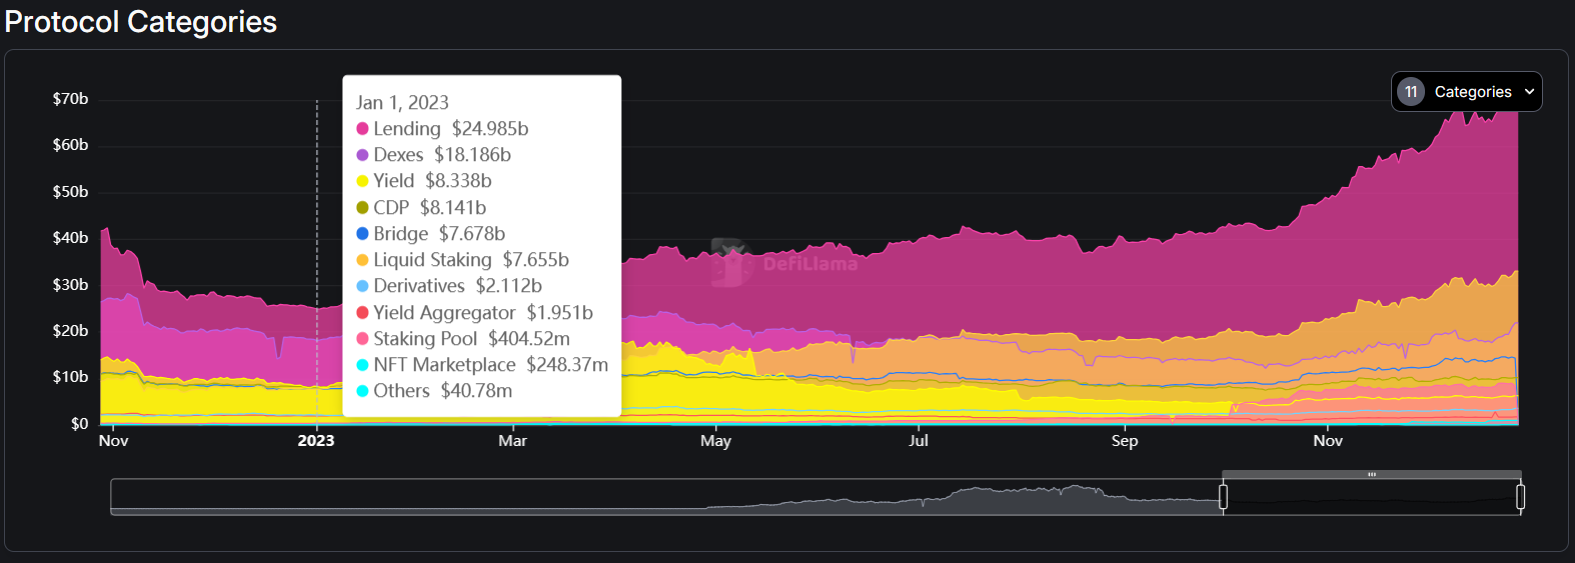
DeFi market TVL distribution
The surge in Liquid Staking was such that Lido DAO, the biggest protocol in this category, outshined other top DeFi applications (Dapp), including AAVE, which belongs to the Lending category, the biggest by TVL. Today, Lido has over $22.3 billion worth of TVL, which is twice AAVE’s $10.9 billion.
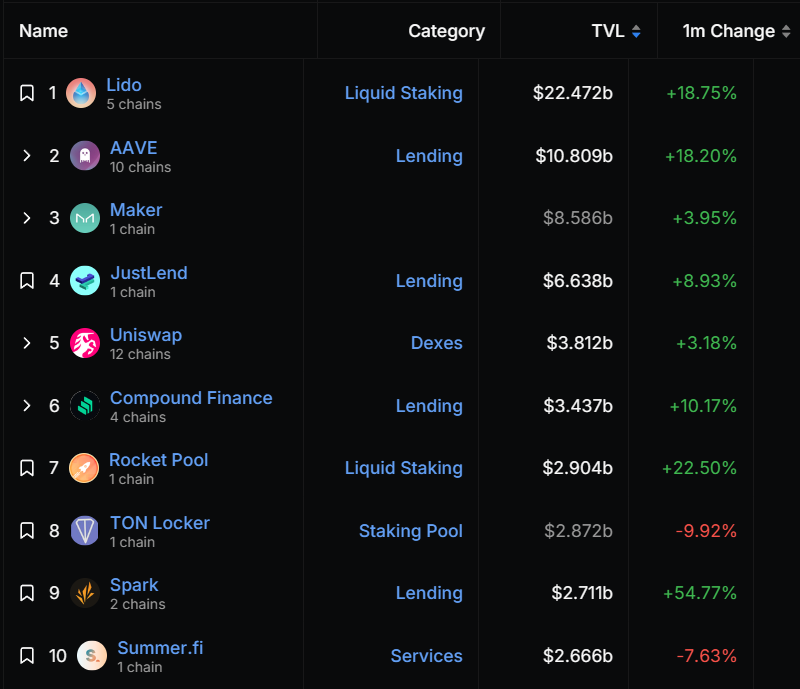
Top DeFi protocols by TVL
Come 2024, the demand for DeFi is expected to increase, and naturally, investors will choose to put their money in the safest form of returns, which could be being a validator on Ethereum. This will further boost the steady rise of TVL of Liquid Staking protocol, making it likely unsurpassable by any other Dapp category.
Recommended Articles


