BNB Price Forecast: BNB bulls aim above $700 as stablecoin and DEX activity surge

Source Fxstreet
  • BNB price stabilizes around $674 on Tuesday after a three-day recovery rally.
  • On-chain data support the bullish outlook, withBNB’s DEX volume and stablecoin activity rising sharply.
  • The technical outlook shows a bullish breakout, aiming for a higher leg.

BNB (BNB) stabilizes around $674 on Tuesday after a three-day recovery rally. On-chain data and technical outlook suggest a rally ahead as BNB breaks above the symmetrical triangle pattern, with DEX (Decentralized exchange) volume and stablecoin activity surging.

BNB on-chain data show bullish bias

BNB’s stablecoin value has been actively rising and reached $24.2 billion, the highest year-to-date (YTD) level on May 21, according to Atermis terminal data. While the volume has retreated somewhat in recent days, the current level ofstablecoin activity and value increase on BNB is positive as they increase network usage and can attract more users to the ecosystem.

BNB chain stablecoin activity chart. Source: Artemis

BNB chain stablecoin activity chart. Source: Artemis

Another aspect bolstering the platform’s bullish outlook is the recent surge in traders’ interest and liquidity in the BNB chain. The chart below shows that BNB’s DEX daily trading volume soared to $11.8 billion on May 21, the highest YTD and constantly rising since mid-May. 
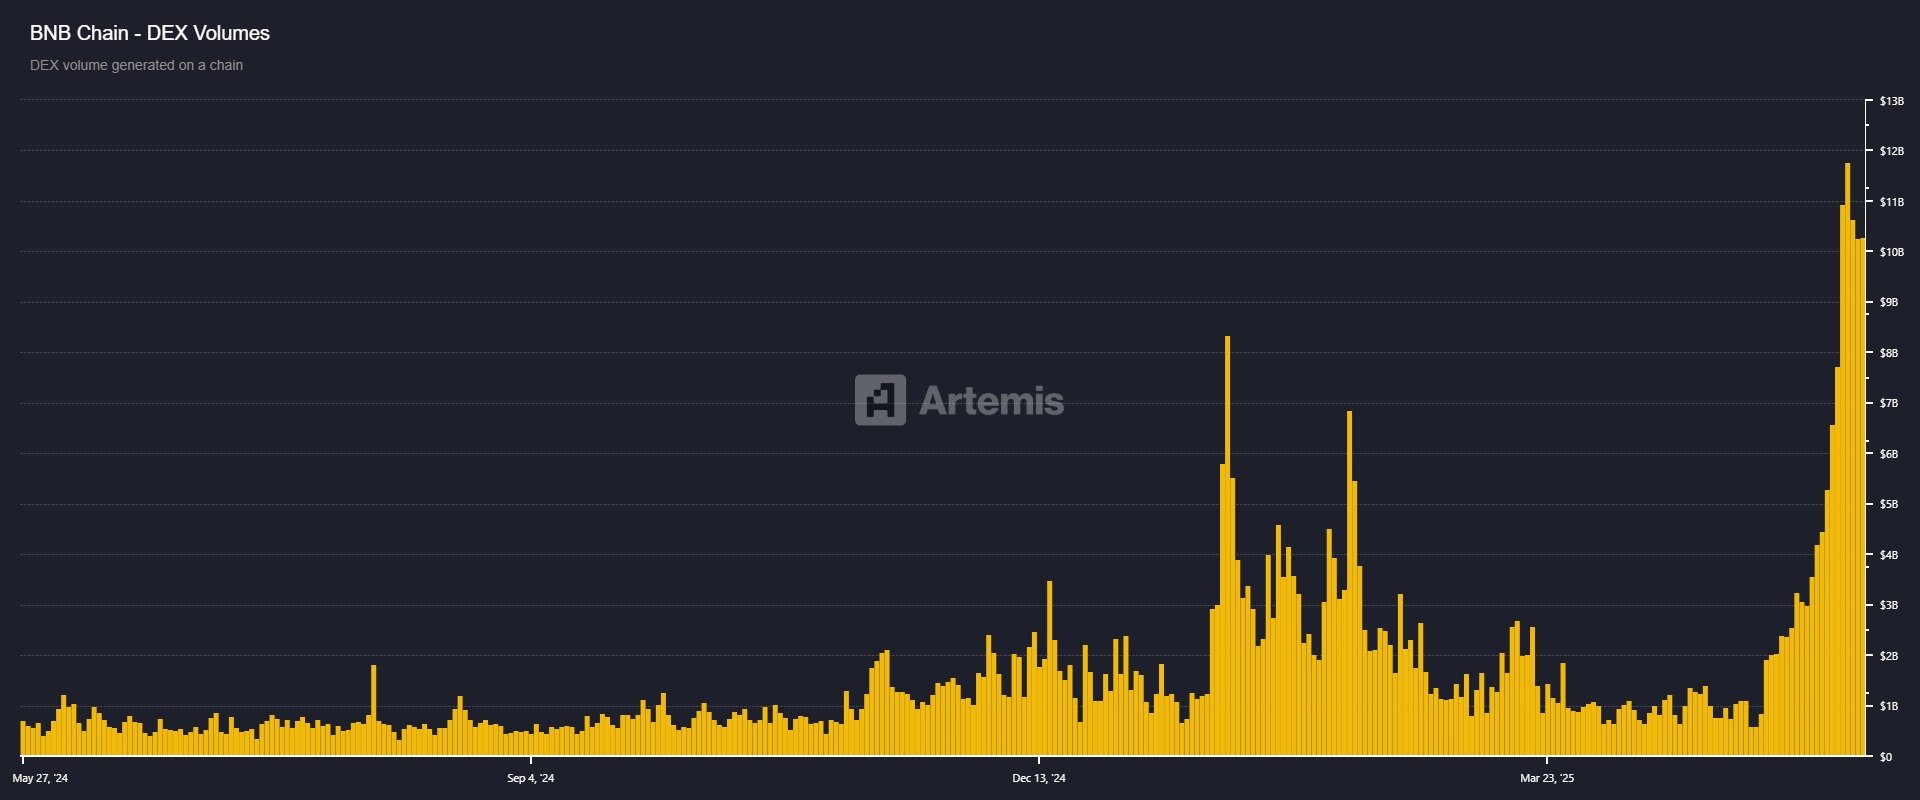
BNB chain Dex volume chart. Source: Artemis

BNB chain Dex volume chart. Source: Artemis

BNB Price Forecast: Bullish symmetrical triangle breakout emerges

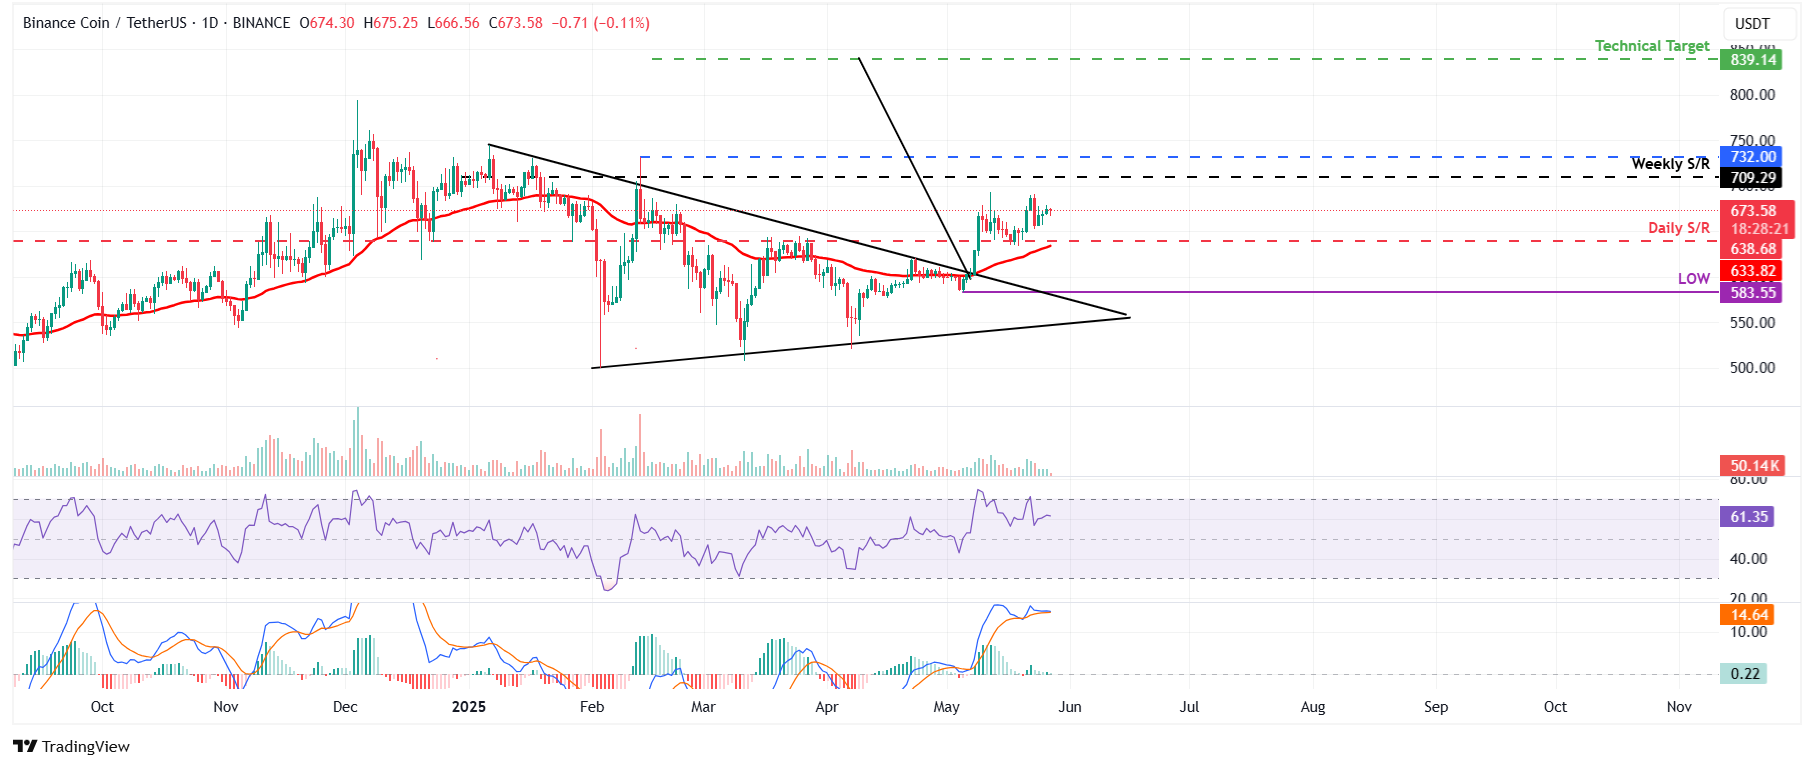
BNB’s price broke above a symmetrical triangle on May 8, a technical pattern formed by connecting multiple highs and lows with two converging trendlines (from January to early May), and rallied more than 10%. However, BNB corrected 4.31% last Friday but recovered slightly in the following three days. At the time of writing on Tuesday, it hovers around $673.50.

BNB price could extend the rally to reach the technical target of the symmetrical triangle at $839.14 (obtained by measuring the distance between the first daily high and the first daily low and adding it to the breakout point). This is a theoretical target, and traders could realize some profits around the weekly level of $709.29 and at the Feburary 13 high of $732.

The Relative Strength Index (RSI) on the daily chart reads 61 points upward, indicating strong bullish momentum while still below overbought levels. However, the Moving Average Convergence Divergence (MACD) indicator on the daily chart converges, indicating indecisiveness among the traders.
BNB/USDT daily chart

BNB/USDT daily chart

If BNB faces a pullback, it could extend the decline to retest its next daily support at $638.68. A close above this level would invalidate the bullish thesis, with next support located at the May 5 low of $583.55.

Disclaimer: For information purposes only. Past performance is not indicative of future results.
placeholder
Bitcoin To Face ‘One Last Speed Bump’ Before Rally To $140,000 – AnalystBitcoin (BTC) is attempting to reclaim a crucial level as support, which could propel its price to its local range high.
Author  NewsBTC
7 hours ago
Bitcoin (BTC) is attempting to reclaim a crucial level as support, which could propel its price to its local range high.
placeholder
Australia hands Tesla lifeline with May sales surge, struggles persist elsewhereAustralia just gave Tesla something it hasn’t had in a while—relief. The company said on Tuesday that it sold 3,897 electric vehicles in Australia in May 2025, its best monthly performance in nearly a year, according to data reported by CNBC.
Author  Cryptopolitan
7 hours ago
Australia just gave Tesla something it hasn’t had in a while—relief. The company said on Tuesday that it sold 3,897 electric vehicles in Australia in May 2025, its best monthly performance in nearly a year, according to data reported by CNBC.
placeholder
Bank of England Governor Bailey releases more aggressive monetary policy,Will the British pound continue to rise or turn around and fall?The latest International Monetary Fund (IMF) report, "World Economic Outlook," shows that the UK economy has demonstrated unexpected resilience, leading to an upward revision of the GDP growth forecast for 2025 from 1.1% to 1.2%.
Author  TradingKey
7 hours ago
The latest International Monetary Fund (IMF) report, "World Economic Outlook," shows that the UK economy has demonstrated unexpected resilience, leading to an upward revision of the GDP growth forecast for 2025 from 1.1% to 1.2%.
placeholder
GBP/JPY Price Forecast: Seems poised to build on momentum beyond 195.00 markThe GBP/JPY cross builds on the previous day's goodish rebound from the 192.75-192.70 area, or over a one-week low, and gains positive traction for the second straight day on Wednesday.
Author  FXStreet
7 hours ago
The GBP/JPY cross builds on the previous day's goodish rebound from the 192.75-192.70 area, or over a one-week low, and gains positive traction for the second straight day on Wednesday.
placeholder
USD/CAD Price Forecast: Tests initial support near 1.3950, followed by nine-day EMAThe USD/CAD pair is retracing its recent gains registered in the previous session, trading around 1.3710 during the European hours on Wednesday. The daily chart's technical analysis suggested a persistent bearish sentiment, as the pair consolidates within the descending channel pattern.
Author  FXStreet
7 hours ago
The USD/CAD pair is retracing its recent gains registered in the previous session, trading around 1.3710 during the European hours on Wednesday. The daily chart's technical analysis suggested a persistent bearish sentiment, as the pair consolidates within the descending channel pattern.
Related Instrument
goTop
quote