


AI altcoins pump, likely strongest narrative this bull run as Nvidia becomes top 3 firm globally by market cap
- Nvidia has surpassed Saudi Aramco to become the third-largest company in the world by market capitalization.
- AI crypto coins are flashing green, with GRT, AGIX, and OCEAN marking the biggest gainers.
- AI narrative could become the strongest narrative this bull run if meme coins fail sustain gains.
The cryptocurrency market tends to move in groups, with sector tokens moving together as part of a narrative rally. Currently, meme coins and AI crypto coins are the ongoing mania, with the former driven by the directional cue given by Bitcoin (BTC) price.
Also Read: Worldcoin price defends $7.00 despite Elon Musk’s confirmation of legal action against OpenAI
Nvidia joins the top three list of companies by market cap
Among others, Nvidia company has had a significant role in catalyzing rallies among AI altcoins. Nvidia Corporation is an American multinational technology company, whose influence on AI crypto coins comes because of its work in developing computer chips. These are critical in AI technology development.
Data according to companiesmarketcap.com shows that Nvidia has overtaken Saudi Aramco to become the third-largest company on market capitalization metrics. Microsoft and Apple are in first and second places respectively.
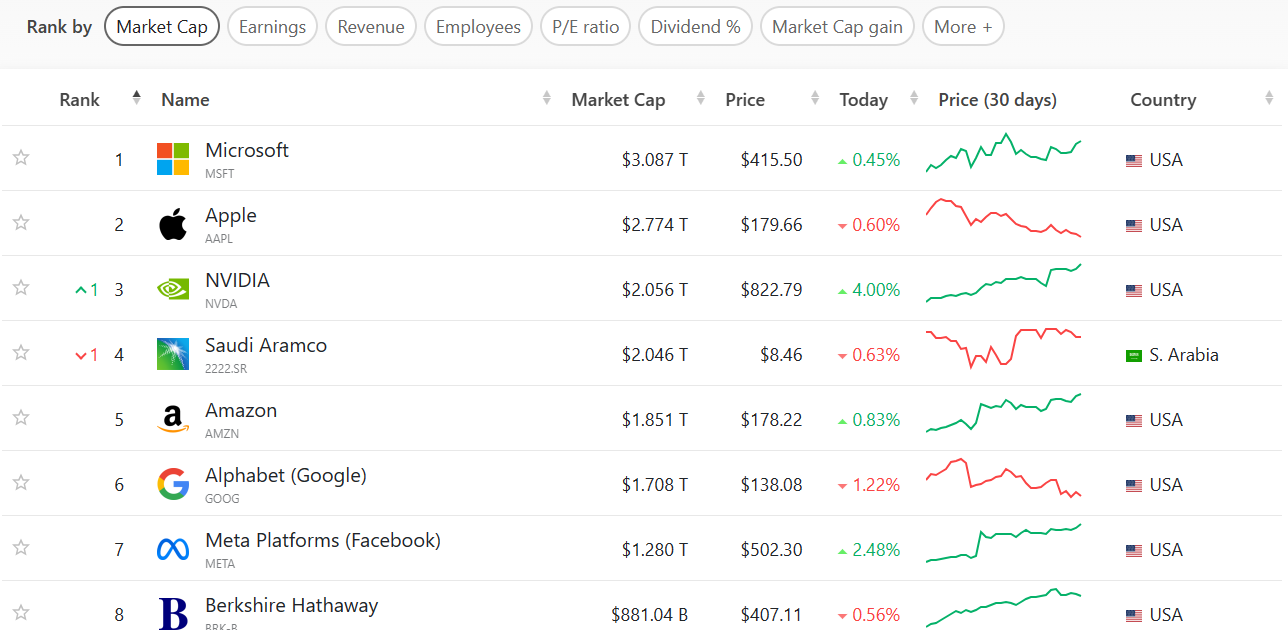
Companies by market capitalization
The move is inspired by the growing relevance of AI technology to daily life. The reliance on AI continues to grow in functionality, a move that progressively bodes well for AI crypto coins.
With this report, AI altcoins are pumping, with projects such as The Graph (GRT), SingularityNET (AGIX), and The Ocean Protocol (OCEAN) up 8%, 7%, and 18% respectively. Others like OriginTrail (TRAC) and PAAL AI (PAAL) are up 20% and 23% respectively. Echelon Prime (PRIME) is up 5%.
Meme coins rally on the Bitcoin cue
The AI narrative could be the best performer, save for the fact that meme coins tend to move with Bitcoin during bull markets. This comes as traders look for projects that have strong fundamentals but going at more affordable rates.
Accordingly, meme coins are on a tear, with Dogecoin (DOGE), Shiba Inu (SHIB), and Pepe (PEPE), the meme coin top three, boasting 17%, 56%, and 50% respectively. The new entrant Dogwifhat (WIF), built atop the Solana blockchain, is up 35% while Floki Inu (FLOKI) boasts an outstanding 71% in gains over the last 24 hours.
Also Read: Robinhood to list Dogwifhat as WIF tags $1: Is Coinbase next?
Cryptocurrency metrics FAQs
What is circulating supply?
The developer or creator of each cryptocurrency decides on the total number of tokens that can be minted or issued. Only a certain number of these assets can be minted by mining, staking or other mechanisms. This is defined by the algorithm of the underlying blockchain technology. Since its inception, a total of 19,445,656 BTCs have been mined, which is the circulating supply of Bitcoin. On the other hand, circulating supply can also be decreased via actions such as burning tokens, or mistakenly sending assets to addresses of other incompatible blockchains.
What is market capitalization?
Market capitalization is the result of multiplying the circulating supply of a certain asset by the asset’s current market value. For Bitcoin, the market capitalization at the beginning of August 2023 is above $570 billion, which is the result of the more than 19 million BTC in circulation multiplied by the Bitcoin price around $29,600.
What is trading volume?
Trading volume refers to the total number of tokens for a specific asset that has been transacted or exchanged between buyers and sellers within set trading hours, for example, 24 hours. It is used to gauge market sentiment, this metric combines all volumes on centralized exchanges and decentralized exchanges. Increasing trading volume often denotes the demand for a certain asset as more people are buying and selling the cryptocurrency.
What is funding rate?
Funding rates are a concept designed to encourage traders to take positions and ensure perpetual contract prices match spot markets. It defines a mechanism by exchanges to ensure that future prices and index prices periodic payments regularly converge. When the funding rate is positive, the price of the perpetual contract is higher than the mark price. This means traders who are bullish and have opened long positions pay traders who are in short positions. On the other hand, a negative funding rate means perpetual prices are below the mark price, and hence traders with short positions pay traders who have opened long positions.
Recommended Articles


