

Bitcoin's Momentum Weakens: Will It Break the Key Resistance Level of $95,000?
TradingKey - Bitcoin has risen nearly 27% over the past two weeks. Can it continue to climb and break through the key resistance level of $95,000?
On Thursday, Bitcoin (BTC) showed signs of slowing downa slowdown, hovering around $93,000. The day before, it had peaked at $94,696 but failed to break through the $95,000 barrier, which had marked the high from a rebound in March.
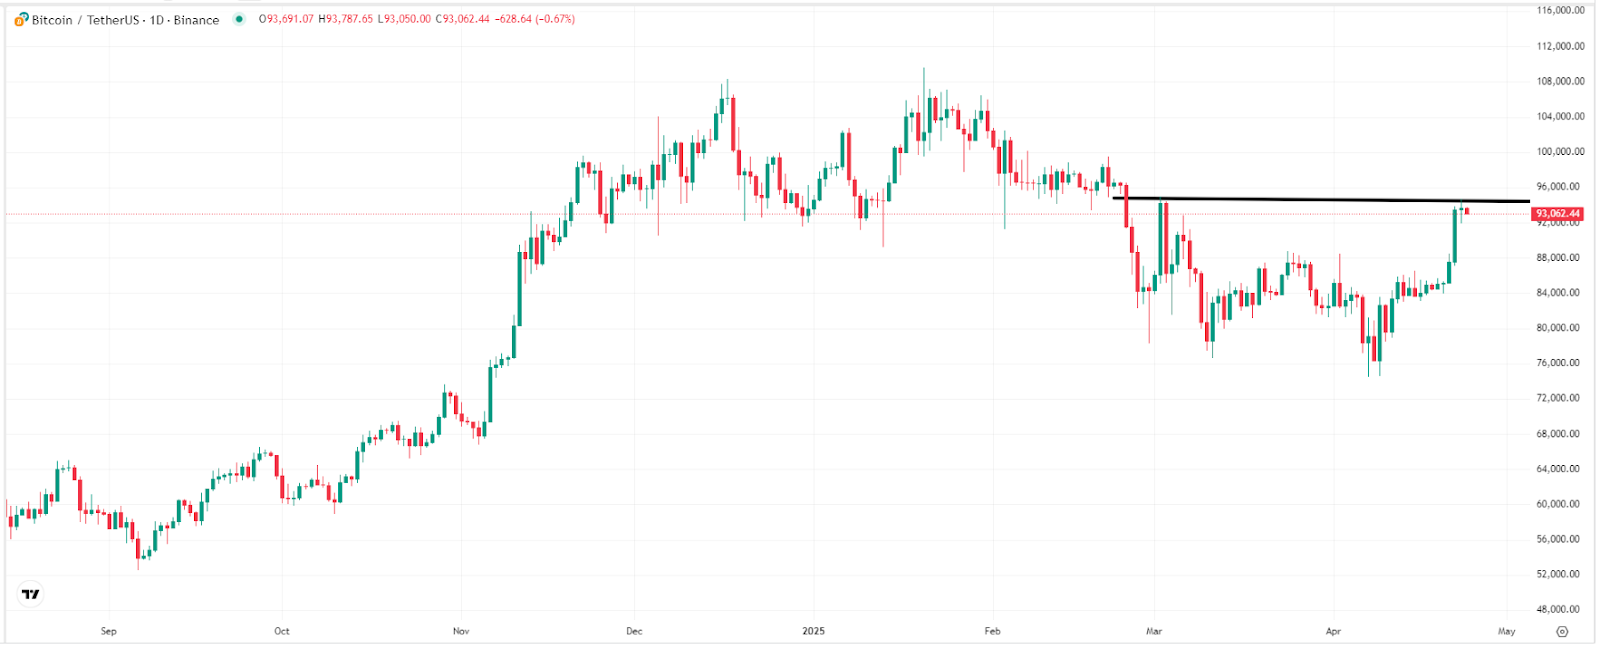
Bitcoin Price Trend Chart, Source: TradingView.
Since April 9, Bitcoin's price has been on the rise, thanks to eased trade tensions. The current price is approaching the critical resistance level of $95,000. Markus Thielen, head of research at 10x Research, remains cautious. He notes that stablecoin minting indicators have not returned to active levels. He believes $95,000 is a key resistance point and a potential trigger for short-term stop-loss liquidations.
However, some market perspectives suggest that even though Bitcoin hasn't yet broken the $95,000 resistance, increased market confidence could lead to a breakthrough soon. The market sentiment has shifted from panic mode, with the fear & greed index rising from a low of 25 to 53.
Additionally, John D'Agostino, head of strategy at Coinbase's institutional division, points out that retail investors are exiting the market through ETFs and spot trading. Meanwhile, sovereign wealth funds and other institutions are accumulating Bitcoin, helping to absorb selling pressure from profit-taking.
Recommended Articles


