

Ethereum (ETH) Tanks to March 2023 Levels as ETH/BTC Ratio Plummets to 5-Year Low
The value of the leading altcoin, Ethereum, has plunged to its lowest point since March 2023, signaling a steep decline in market confidence. This has happened amid the broader market’s downturn, which was exacerbated by Donald Trump’s Liberation Day.
Compounding the bearish sentiment, the ETH/BTC ratio has now dropped to a five-year low, indicating that Bitcoin is gaining relative strength against Ethereum.
ETH/BTC Ratio Hits 5-Year Low as Traders Flee
ETH’s price decline has pushed the ETH/BTC ratio to a five-year low of 0.019. This ratio measures ETH’s relative value compared to BTC. When it rises, it indicates that ETH is outperforming BTC, either because the altcoin’s price is growing faster or the king coin’s price is falling.
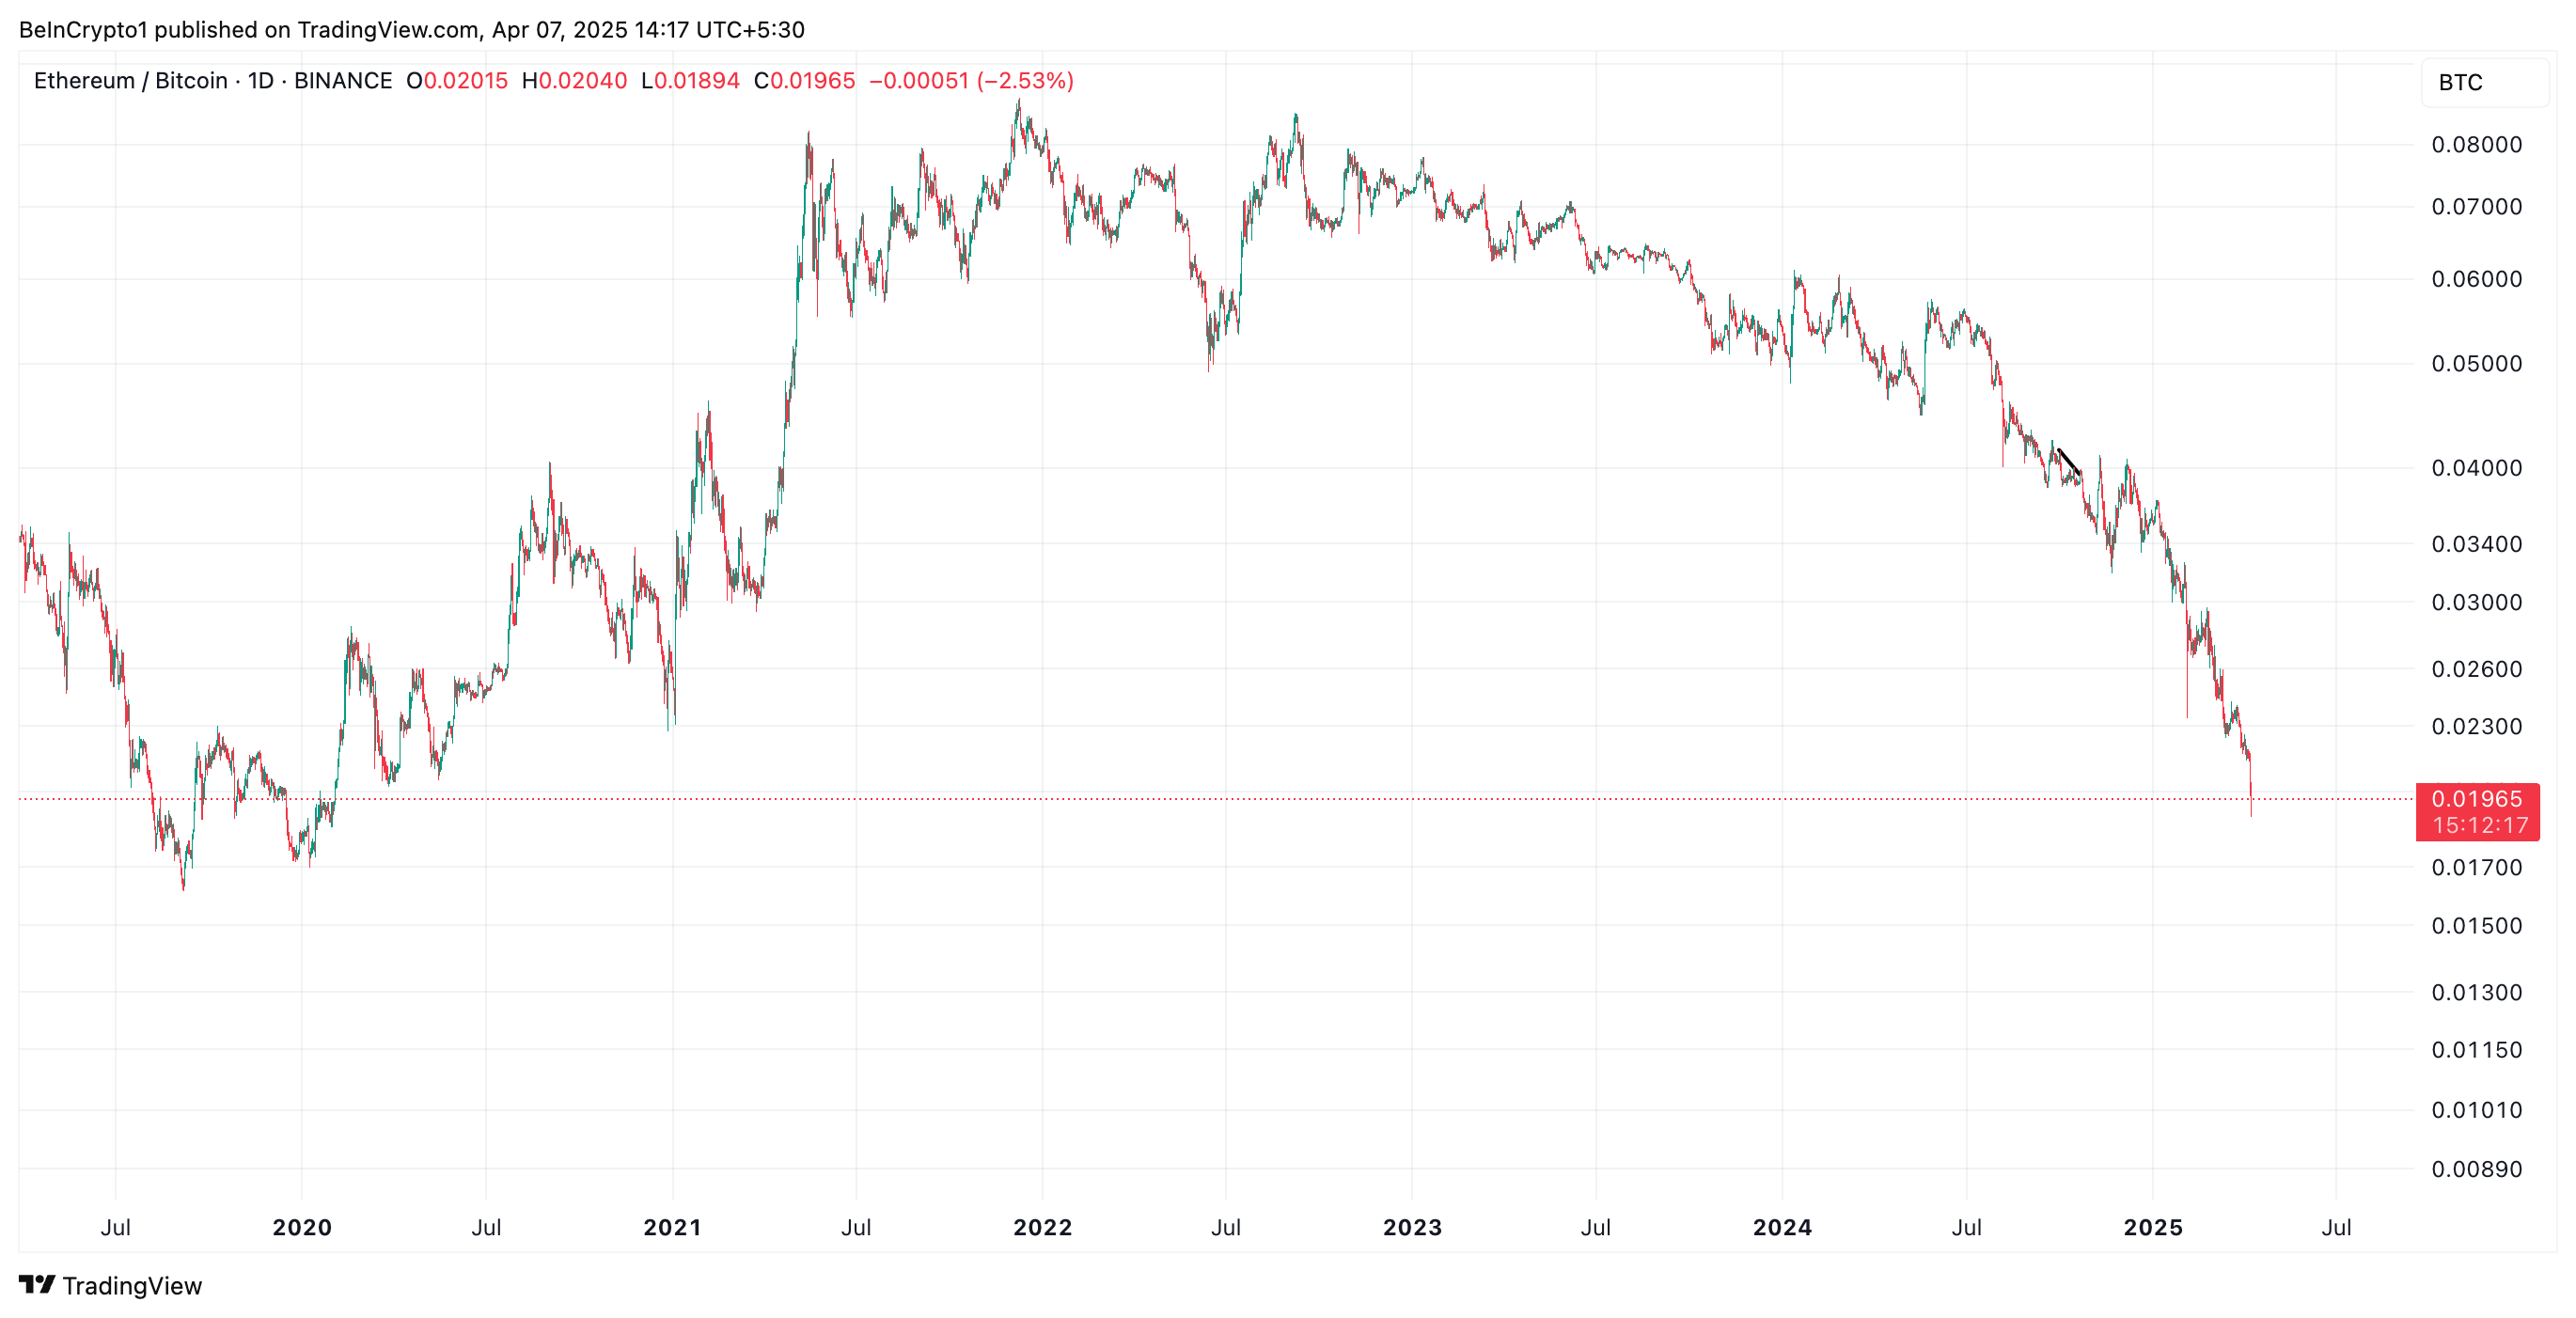 ETH/BTC Ratio. Source: TradingView
Conversely, a decline like this suggests that the leading coin, BTC, is gaining strength relative to the top altcoin, ETH. It suggests that traders are moving capital into BTC, seeing it as a safer or more profitable investment at the moment despite its own price troubles.
Further, on the daily chart, ETH’s negative Chaikin Money Flow (CMF) confirms the coin’s plummeting demand. At press time, it is at -0.07.
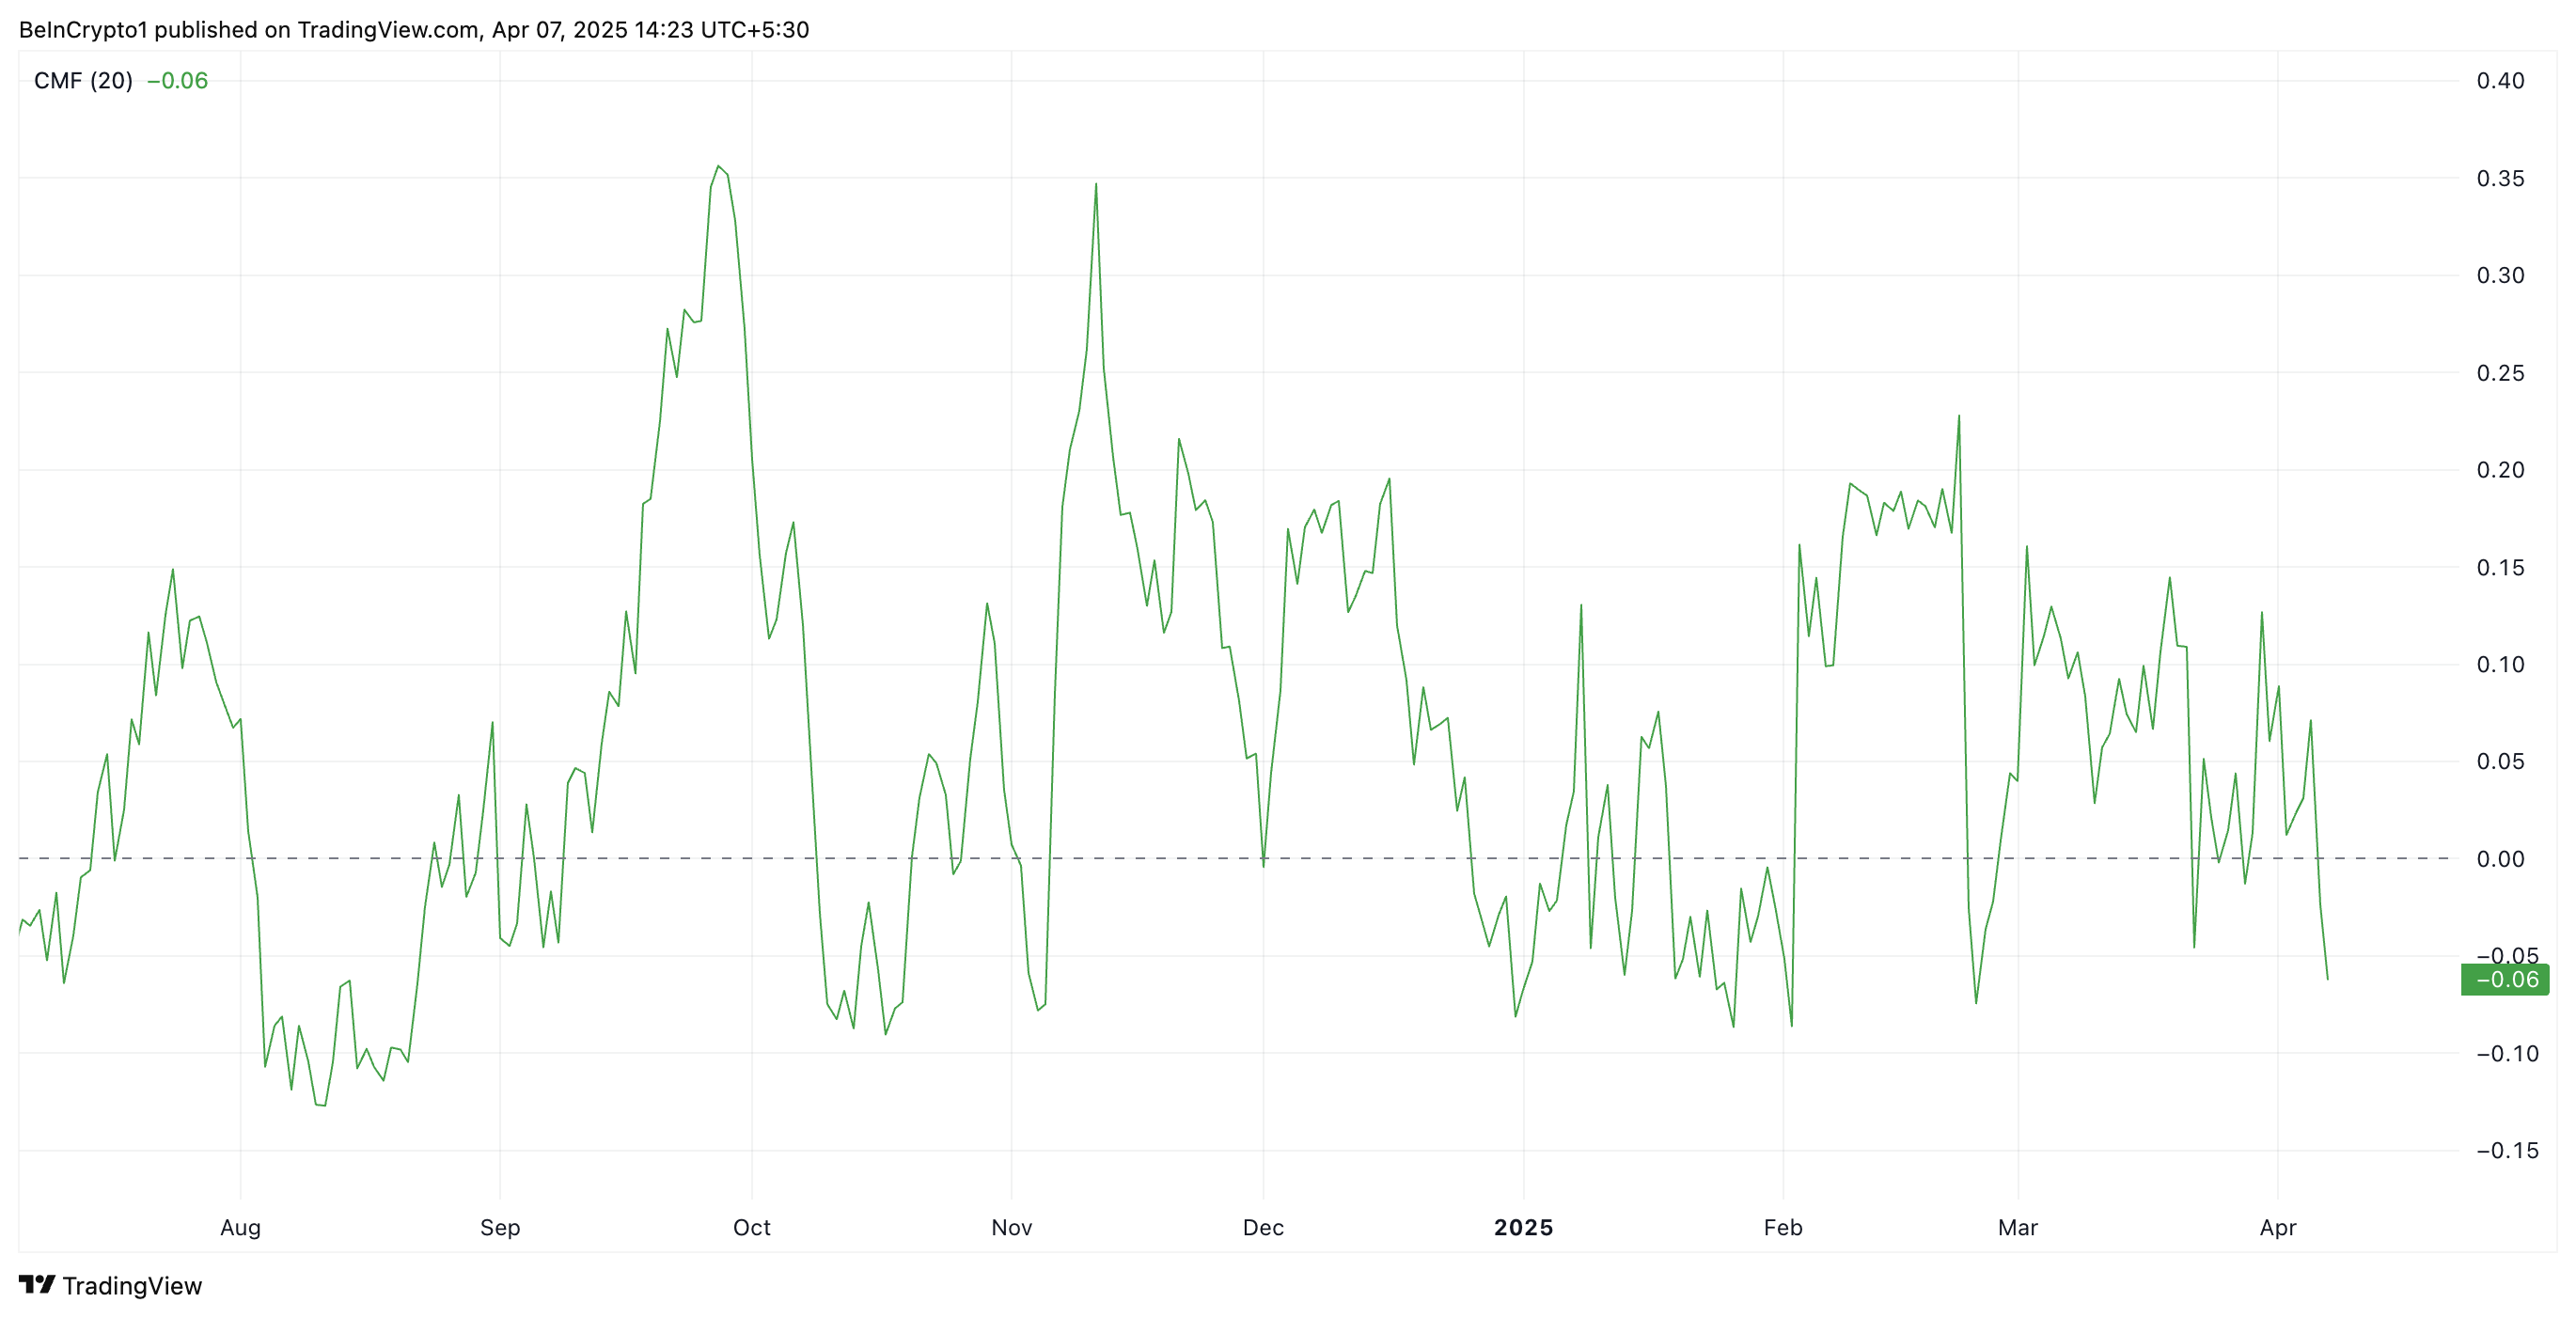 ETH Chaikin Money Flow. Source: TradingView
The CMF indicator measures the volume-weighted accumulation and distribution of an asset over a set period, helping gauge buying and selling pressure. When its value falls below zero like this, it indicates that selling pressure is dominating.
ETH’s CMF readings suggest that more traders are distributing (selling) the coin than accumulating it. This reflects weakening demand and is a bearish signal for the asset’s price momentum.
ETH Flashes Oversold Signal: Is a Bounce Back on the Horizon?
ETH’s Relative Strength Index (RSI), observed on a one-day chart, shows that the altcoin is currently oversold. At press time, the momentum indicator is in a downtrend at 25.62.
The RSI indicator measures an asset’s overbought and oversold market conditions. It ranges between 0 and 100. Values above 70 suggest that the asset is overbought and due for a price decline, while values under 30 indicate that the asset is oversold and may witness a rebound.
At 25.62, ETH’s RSI signals that the coin is deeply oversold. This presents a buying opportunity, as such lows are usually followed by a price rebound.
If this happens, ETH’s price could regain and climb back above $1,589. If this support level strengthens, it could propel ETH’s value to $1,904.
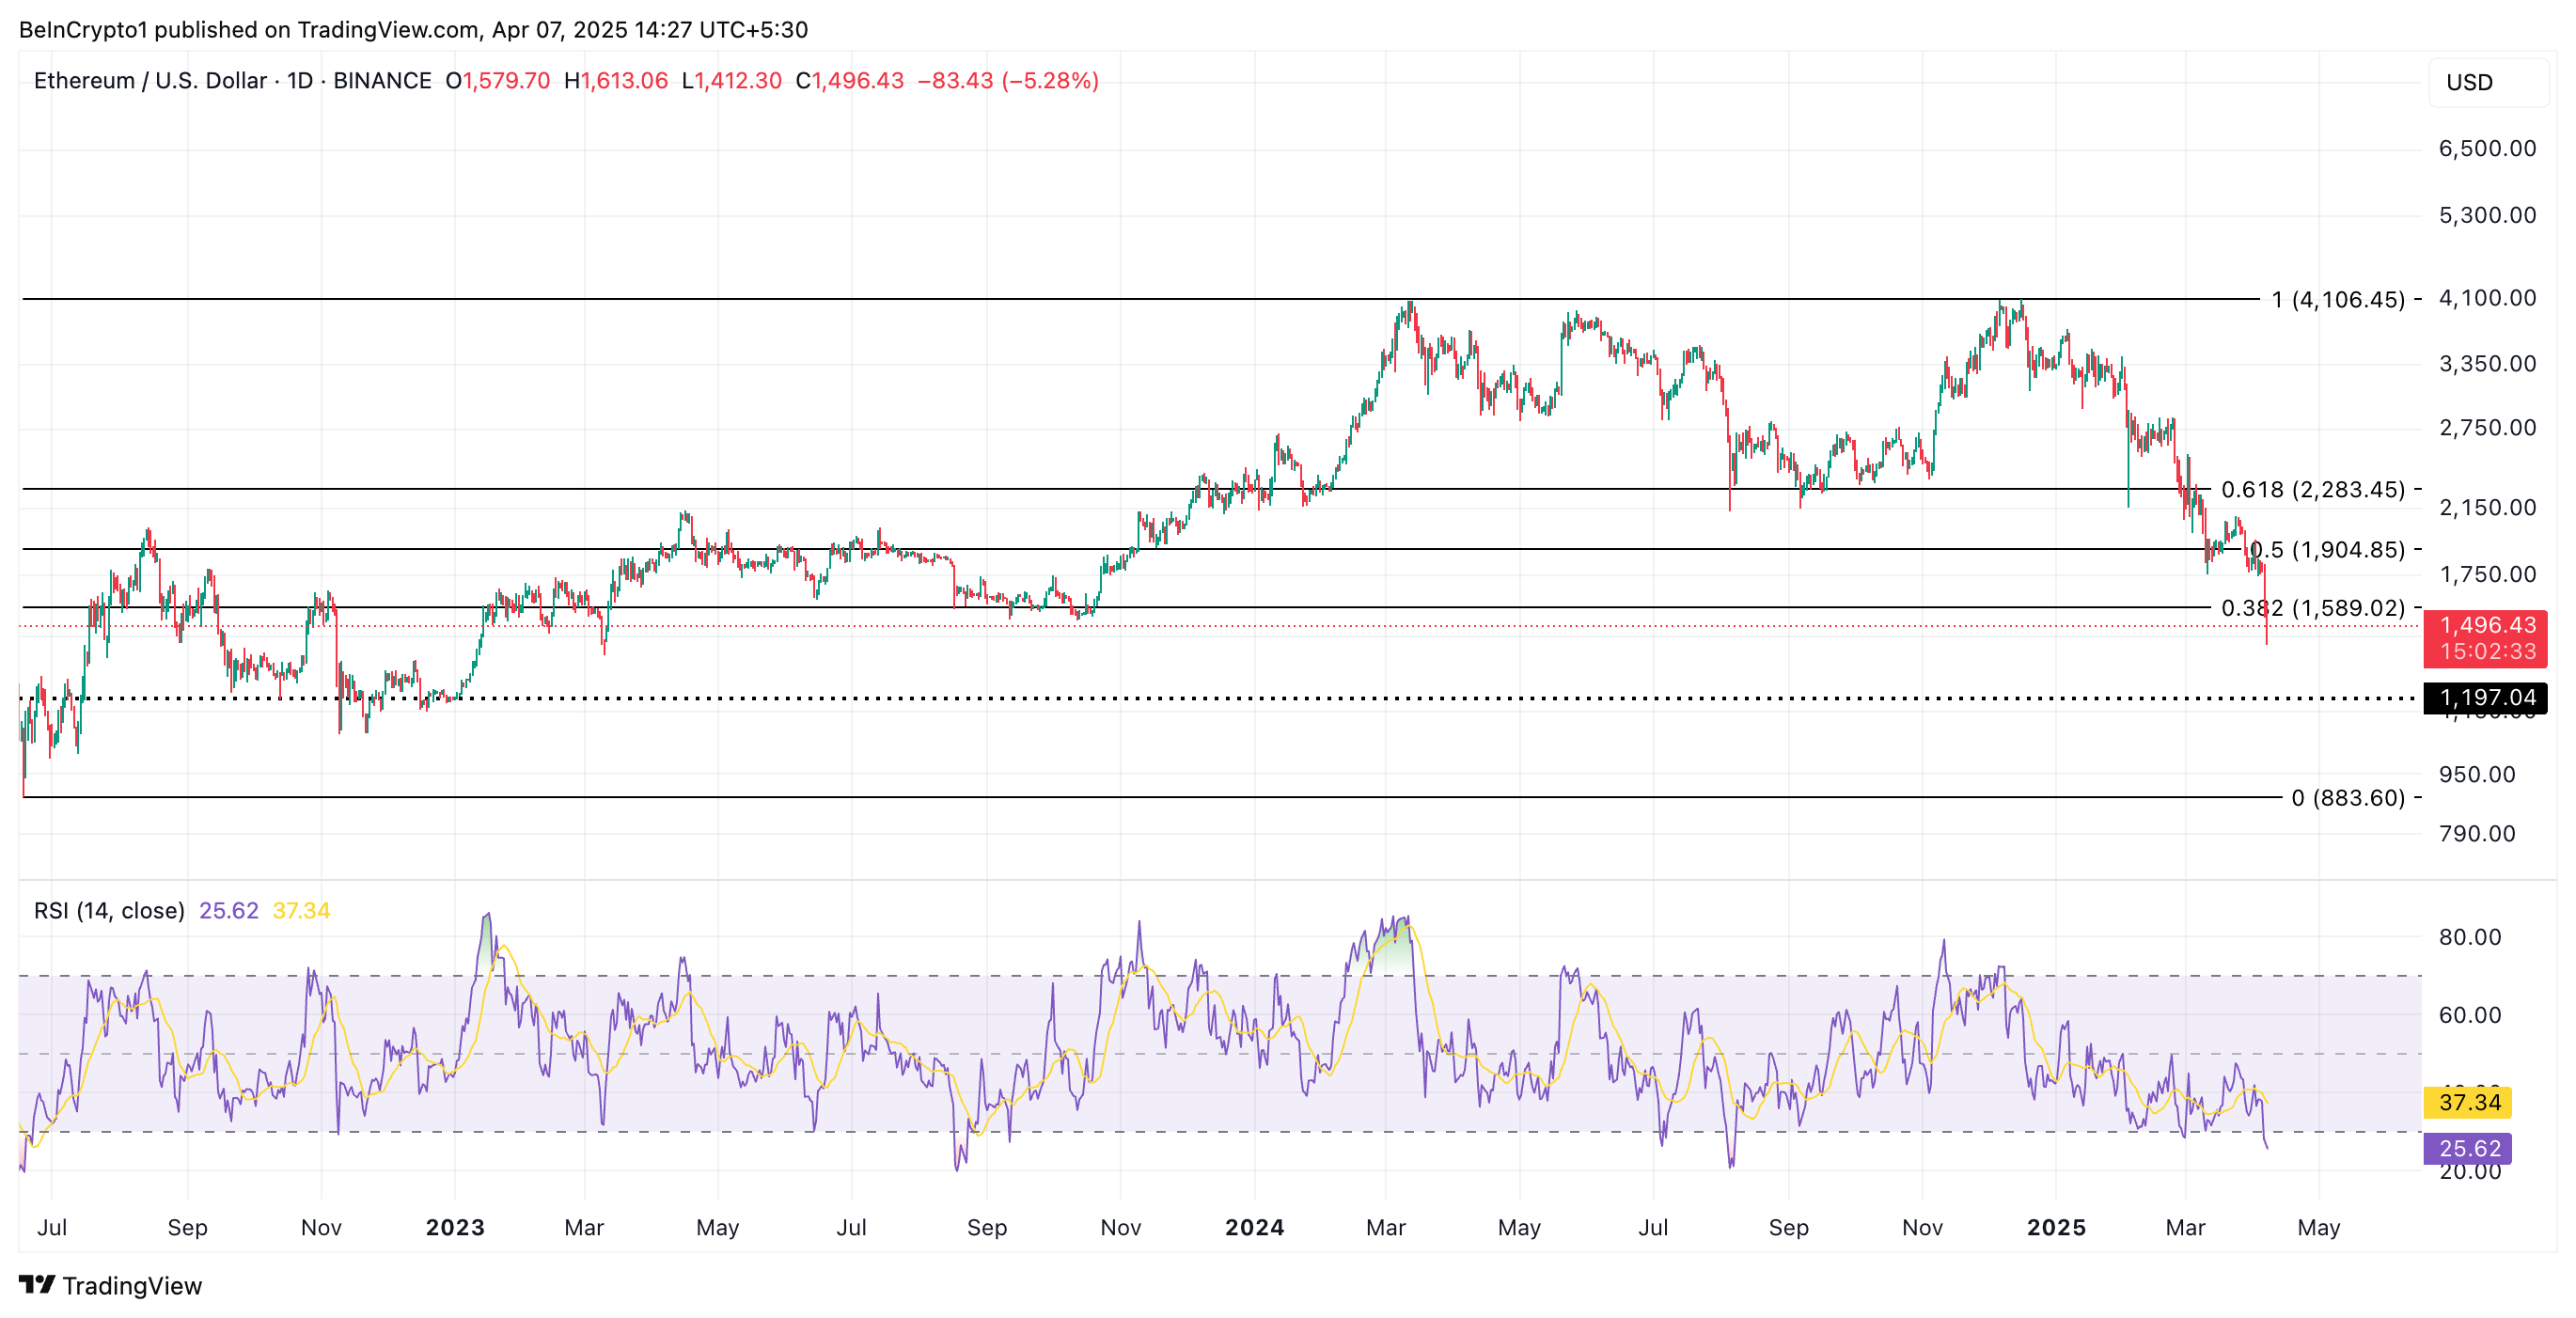 ETH Price Analysis. Source: TradingView
However, this rebound is not guaranteed. If ETH bears maintain dominance and selloffs continue, the coin could extend its decline and fall toward $1,197.
Recommended Articles


