Bitcoin (BTC) Faces Potential Drop Below $80,000: Key Indicators Signal Warning
Bitcoin (BTC) has shown signs of weakness after failing to break the key resistance at $88,800 in the past few days. In the last 24 hours, the price dropped below $87,000, further signaling bearish momentum building in the short term.
Technical indicators like the DMI and Ichimoku Cloud now point toward a shift in trend, with sellers increasingly taking control. As BTC hovers near critical support zones, upcoming US economic data could play a pivotal role in determining whether the next move is a rebound or a deeper correction.
Bitcoin DMI Shows Sellers Took Control
Bitcoin’s DMI (Directional Movement Index) chart currently shows the ADX at 21.51, indicating a weakening trend strength.
Notably, the trend has recently shifted from an uptrend to a downtrend, as reflected in the changing directional indicators. Over the last few days, BTC lost its bullish momentum, and the bears have taken over.
This transition is significant because it often precedes continued selling pressure unless bulls can regain control quickly.
 BTC DMI. Source: TradingView
The ADX (Average Directional Index) measures the strength of a trend, regardless of its direction. Generally, an ADX below 20 suggests a weak or non-existent trend, while a reading above 25 implies a strong trend is underway.
Currently, with ADX at 21.51, Bitcoin is in a zone of growing—but not yet strong—trend strength. Meanwhile, the +DI, which represents bullish strength, has dropped sharply from 26.33 to 14.58, signaling waning buying pressure.
At the same time, the -DI, representing bearish pressure, has surged from 13.2 to 33.41, suggesting sellers have firmly taken control. This sharp crossover between +DI and -DI points to a clear shift in market sentiment and could mean further downside for BTC in the short term if the current trend continues.
BTC Ichimoku Cloud Shows The Downtrend Could Get Stronger
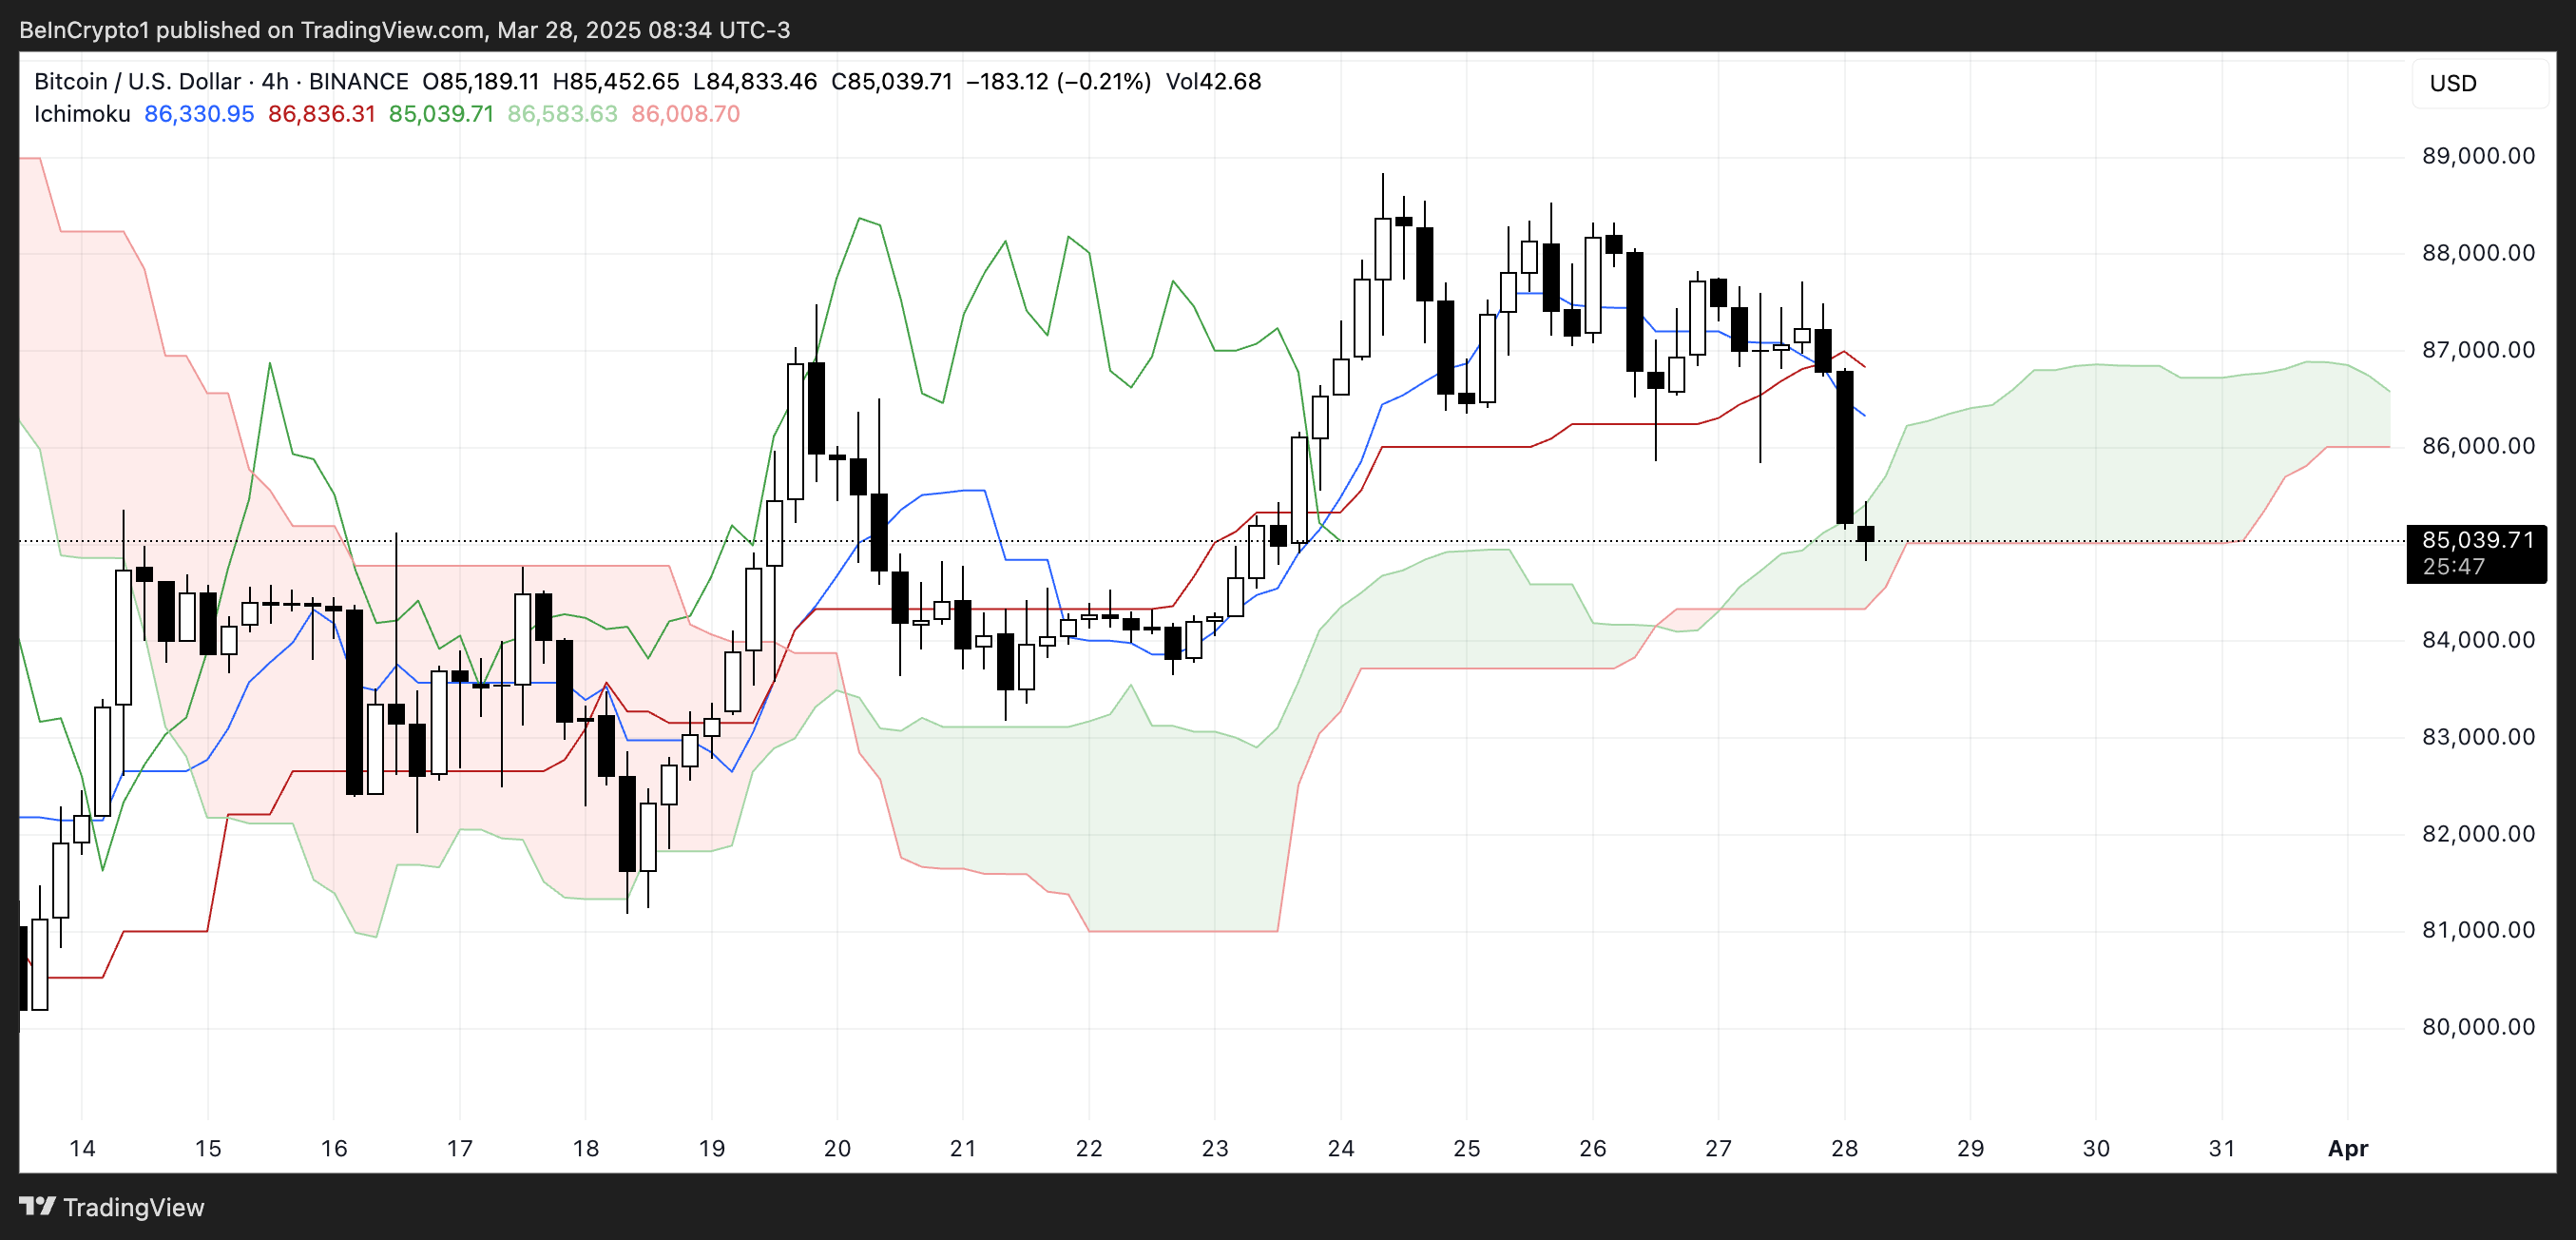
Bitcoin’s Ichimoku Cloud chart is showing signs of a short-term bearish shift. Price action has broken below the Tenkan-sen (blue line) and Kijun-sen (red line), indicating weakening momentum.
More importantly, the most recent candle has decisively pierced through the lower boundary of the green cloud (Kumo), suggesting a potential trend reversal or the beginning of a deeper correction.
This breakdown also means that the cloud, which previously acted as support, may now begin to serve as resistance if price attempts a rebound.
 BTC Ichimoku Cloud. Source: TradingView.
In the Ichimoku system, the cloud represents both support/resistance and trend sentiment. When the price is above the cloud, the trend is bullish; below it, bearish; and within it, the market is in consolidation.
With the current price slipping below the cloud, it signals that bearish pressure is taking control. The future cloud also appears to be thinning, hinting at reduced trend strength ahead.
Unless BTC quickly reclaims the cloud and regains the Tenkan-sen, the bias is likely to remain bearish, with sellers having the upper hand.
Will Bitcoin Reclaim $100,000 In April?
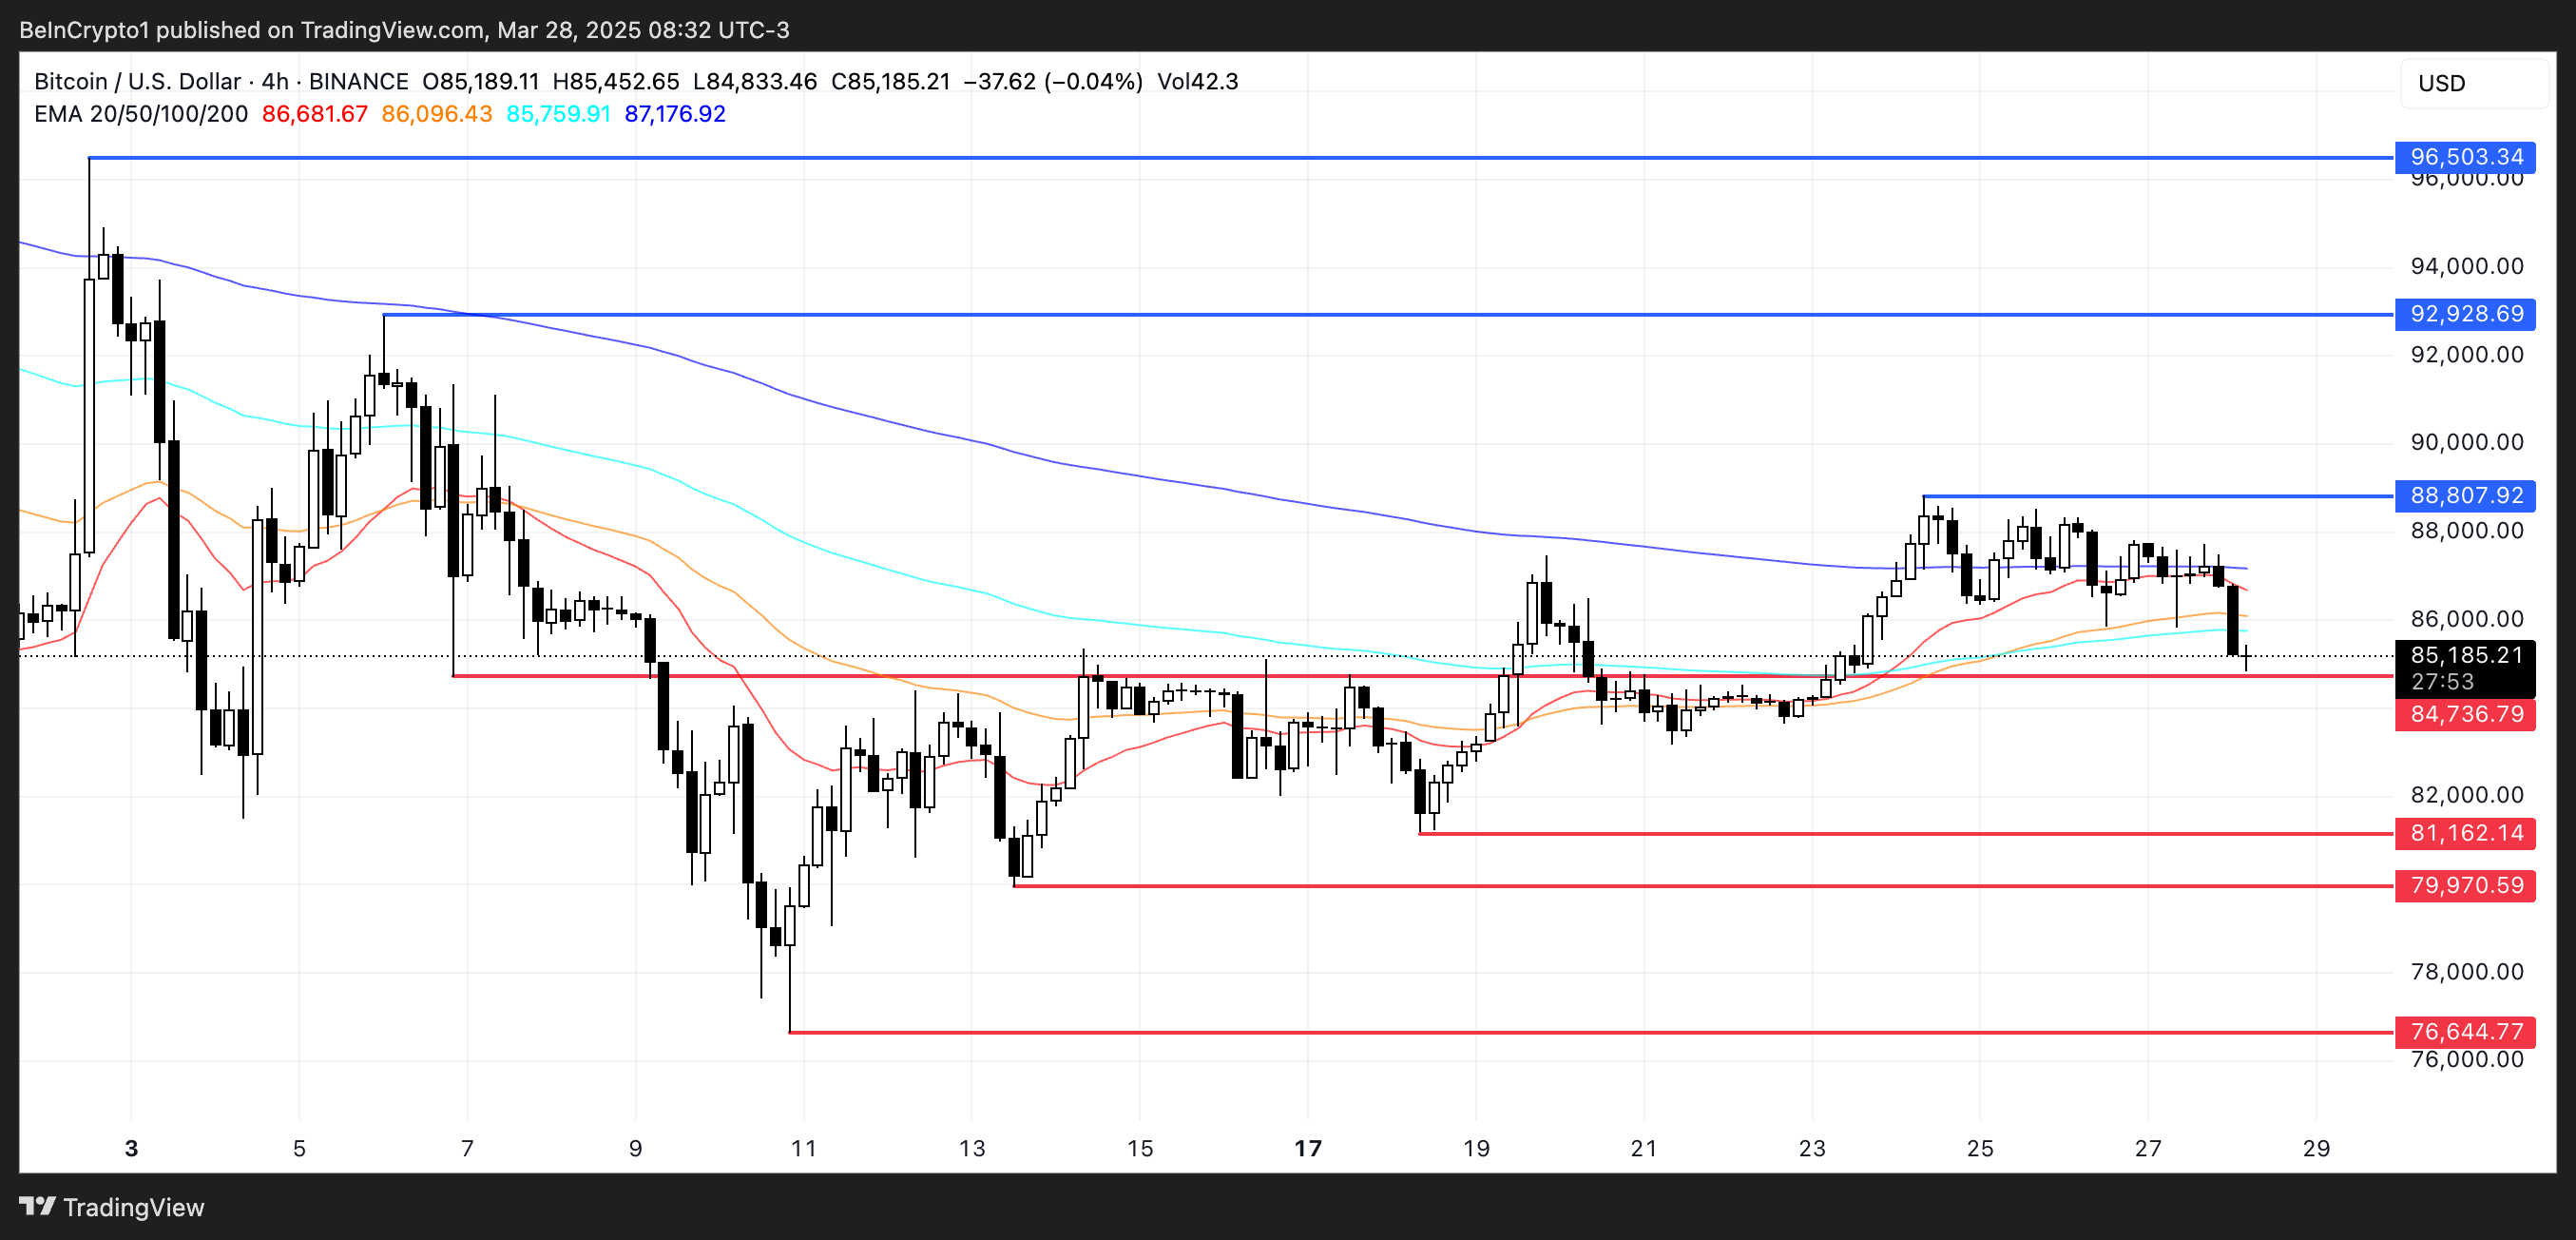
Bitcoin price recently failed to break through the resistance zone near $88,800 and is now drifting toward a key support level at $84,736.
This level will be crucial in determining short-term price direction. If it’s broken, the market could enter a stronger corrective phase, potentially sending BTC toward the next support at $81,162.
A loss of that area could expose Bitcoin to further downside, including a drop below the psychological $80,000 mark, with $79,970 and $76,644 acting as subsequent support levels. The structure suggests that bears are gradually gaining ground, and unless a strong bounce occurs soon, deeper retracements remain on the table.
 BTC Price Analysis. Source: TradingView.
That said, upcoming macroeconomic catalysts from the US, such as PMI data and consumer confidence reports, could sway momentum back in favor of the bulls.
Should these events boost market sentiment and push Bitcoin upward, the price might retest the $88,800 resistance. If BTC breaks above it this time, the next targets lie around $92,928 and potentially $96,503.
A sustained rally beyond those levels could reignite hopes for a move back toward the $100,000 milestone in April.


