


Quarterly Options Expiry Puts Bitcoin and Ethereum to the Test with Over $14 Billion at Stake
Today, approximately $14.21 billion worth of Bitcoin (BTC) and Ethereum (ETH) options are due to expire.
Market watchers are particularly attentive to this event because it has the potential to influence short-term trends through the volume of contracts and their notional value.
$14.21 Billion Bitcoin and Ethereum Options Expiring
The notional value of today’s expiring BTC options is $12.075 billion. According to Deribit’s data, these 139,260 expiring Bitcoin options have a put-to-call ratio of 0.49. This ratio suggests a prevalence of purchase options (calls) over sales options (puts).
The data also reveals that the maximum pain point for these expiring options is $85,000. The maximum pain point is the price at which the asset will cause the greatest number of holders’ financial losses.
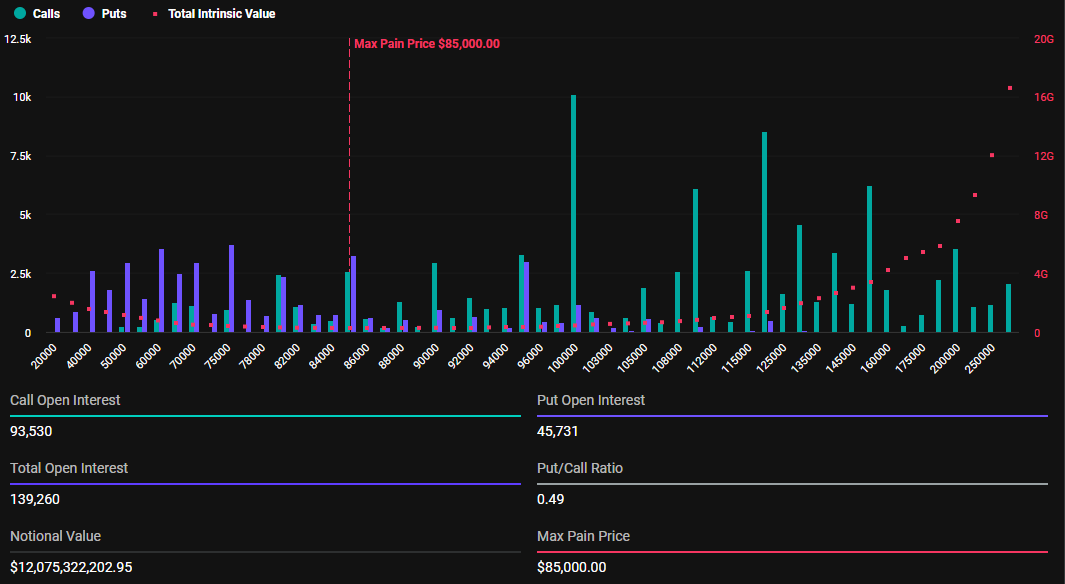 Expiring Bitcoin Options. Source: Deribit
In addition to Bitcoin options, 1,068,519 Ethereum options contracts are set to expire today. These expiring options have a notional value of $2.135 billion, a put-to-call ratio of 0.39, and a maximum pain point of $2,400.
The number of today’s expiring Bitcoin and Ethereum options is significantly higher than last week. BeInCrypto reported that last week’s expired BTC and ETH options were 21,596 and 133,447 contracts, respectively. In the same tone, they had notional values of $1.826 billion and $264.46 million, respectively.
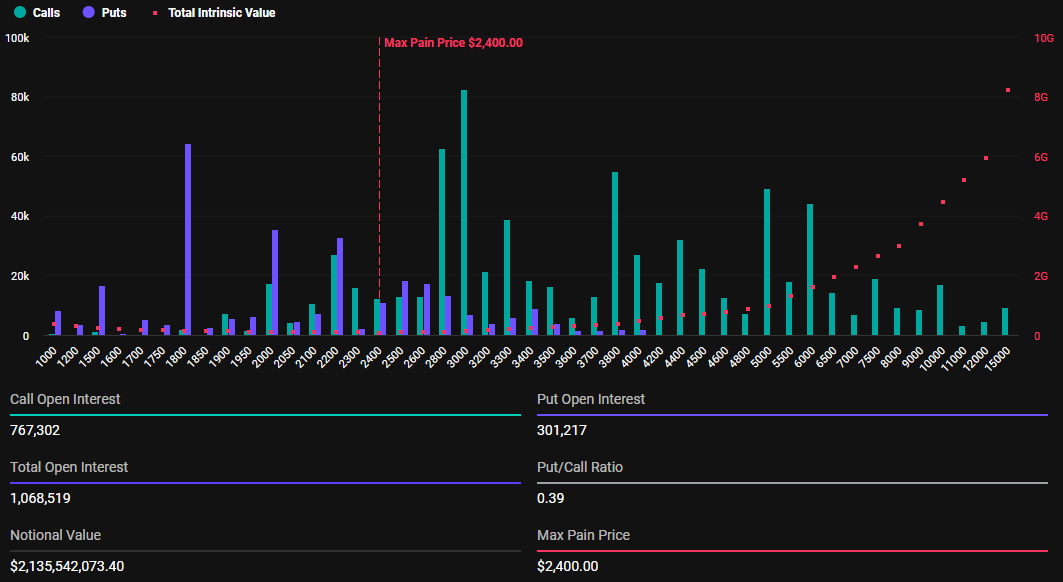 Expiring Ethereum Options. Source: Deribit
This notable difference comes as this week’s expiring options are for the month and the quarter, with this being the last Friday of March. Deribit options expiry happens on Fridays because it aligns with traditional financial (TradFi) market practices and provides a consistent schedule for traders.
In many global markets, including equities and derivatives, expiration dates for options contracts are commonly set for the end of the trading week—often Friday—to standardize timing and facilitate settlement processes.
Deribit adopted this convention to maintain familiarity for traders transitioning from TradFi to crypto markets and to ensure liquidity and market activity peak at a predictable time.
“Tomorrow is not just any Friday; it’s one of the biggest expiries of the year. Over $14 billion in BTC and ETH options are set to expire at 08:00 UTC. How do you think Q1 will wrap?” Deribit posed in a Thursday post.
Implied Volatility Heading Into Quarterly Options Expiry
Indeed, today’s options expiry concludes the first quarter (Q1) in options expirations. As this happens, analysts at Deribit, a cryptocurrency derivatives exchange, observe the implied volatility (IV) curves for BTC and ETH, showing market expectations of price swings.
Specifically, Bitcoin’s curve indicates a strong bias toward higher prices (upside skew) as calls are priced much higher than puts. On the other hand, Ethereum’s flatter volatility curve suggests less directional bias but still reflects elevated volatility. This hints at anticipated price movement around the expiry date of the $14.21 options.
“Chart 1 – $BTC: BTC showing some serious upside skew, calls priced way higher. Chart 2 – $ETH: ETH’s curve is flatter, but volume is still elevated across the board. Both markets signal anticipation of movement into or post-expiry,” Deribit noted.
 Implied Volatility Curves for BTC and ETH. Source: Deribit on X
This suggests that both Bitcoin and Ethereum markets anticipate movement into or post-expiry. Elsewhere, analysts at Greeks.live shed light on current market sentiment, citing a cautiously bearish outlook dominating investors’ perspective for Bitcoin.
Specifically, they suggest that most traders anticipate a retest of lower price levels around $84,000–$85,000. Bitcoin trading for $85,960 as of this writing indicates a potential downward move in the short term.
However, some traders observe that Bitcoin is stuck in a tight, range-bound trading pattern, implying limited volatility unless a breakout occurs. Against this backdrop, Greeks.live highlights key technical levels.
“Key resistance levels being watched are 88,400 where significant passive selling was observed, and potential support at 77,000 which one trader called the definite bottom,” the analysts wrote.
Greeks.live analysts also observe that Implied Volatility is under pressure due to the quarterly delivery, noting significant deviations in the IV Mark. This suggests opportunities for traders to exploit these fluctuations through manual or automated strategies.
Recommended Articles


