

Fidelity Prepares to Compete with USDT and USDC with Its Own Stablecoin
Fidelity Investments, one of the world’s largest asset management firms with $5 trillion in assets, is preparing to deepen its involvement in the crypto market by launching its own stablecoin.
This move comes as the US government, under President Donald Trump, accelerates regulatory reforms in the crypto industry. These changes are creating favorable conditions for traditional financial institutions to enter the space.
What Is Fidelity’s Ambition Behind Its Stablecoin Plan?
According to the Financial Times, Fidelity has already reached an advanced testing phase for its stablecoin. The company aims to use it as a form of “cash” for transactions in the crypto market. This strategy signals direct competition with leading stablecoins like USDT and USDC, which currently dominate market liquidity.
Additionally, Fidelity’s stablecoin is likely designed to be pegged to the US dollar, maintaining a 1:1 reserve backed by US Treasury bonds—a familiar model in the industry. However, Fidelity’s ambitions go beyond just issuing a stablecoin. The company plans to integrate it with a broader asset tokenization strategy.
Last weekend, Fidelity filed an application to launch a digital money market fund in May 2025. This move directly competes with industry giants like BlackRock and Franklin Templeton.
Cynthia Lo Bessette, Head of Digital Asset Management at Fidelity, believes that tokenization could transform finance. She highlights its potential to enable digital assets to be used as collateral for margin requirements in trading.
The global stablecoin market is currently valued at $234 billion, and Fidelity clearly wants a share of this rapidly growing sector.
Moreover, Fidelity has shown a strong interest in cryptocurrency, particularly Bitcoin, for years. In January 2025, Fidelity Digital Assets released its “2025 Look Ahead” report, which suggested that Bitcoin was on the verge of mainstream adoption and reassured investors that they were “not too late” to enter the market.
Chris Kuiper, Director of Research at Fidelity Digital Assets, predicts that 2025 will mark a turning point. He expects digital assets to cross the threshold into mainstream acceptance, driven by growing adoption from nations and major corporations.
Fidelity has long positioned itself as a pioneer in institutional crypto services. Since 2018, the company has offered Bitcoin custody solutions to institutional investors, demonstrating its long-term vision for blockchain technology.
The Stablecoin Race Is Heating Up
The stablecoin market is becoming increasingly competitive as major players join the race. Tether (USDT), the largest stablecoin, currently holds a $144 billion market capitalization, accounting for over 61% of the market. Meanwhile, Circle (USDC) continues to expand its influence.
With new stablecoins emerging and competing to replace USDT and USDC, the race is intensifying. CZ, the former CEO of Binance, believes that competition will only make the market more dynamic.
“No need to replace. The more, the merrier,” CZ commented.
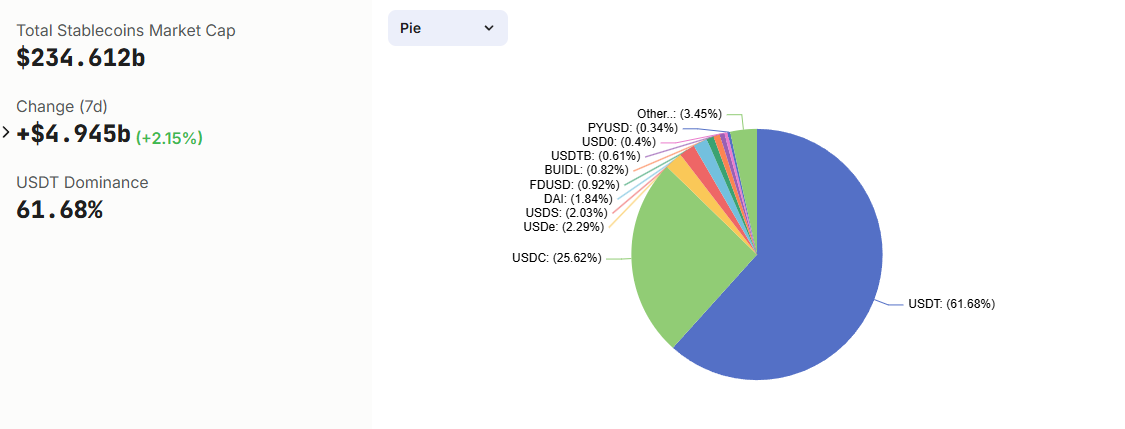 Stablecoin market share in the crypto industry. Source: DefiLlama
According to DefiLlama, the total stablecoin market capitalization has surged from $130 billion at the end of 2023 to over $200 billion by December 2024. Bitwise predicts this figure could reach $400 billion by the end of 2025.
It’s not just crypto-native companies entering the market. Traditional financial institutions and fintech firms like PayPal (with PYUSD), Custodia Bank, and Vantage Bank are also joining the space.
Notably, World Liberty Financial, a project backed by the Trump family, announced its USD1 stablecoin on March 25, 2025. The project raised $550 million in just a few months, highlighting the growing interest in stablecoins from both political and financial players.
Recommended Articles


