

Ethereum Price Forecast: ETH risks further decline as transaction fees drop to all-time lows
Ethereum price today: $2,080
- Ethereum transaction fees plummeted to all-time lows as prices remain subdued by Trump's tariff decisions.
- Grayscale notes that the declining transaction fees are responsible for ETH's underperformance in the current market cycle.
- ETH could rise to $2,200 if it firmly clears the $2,069 resistance.
Ethereum (ETH) tested the resistance at $2,069 on Monday following its transaction fees dropping to an all-time low. The Grayscale Research team highlighted that ETH's weak price and underperformance of top cryptocurrencies over the past year stems from its declining transaction fees.
Ethereum faces downside pressure from reduced transaction fees
The recent crypto downturn, sparked by President Donald Trump's tariff threats, has largely affected Ether's performance. The top altcoin has declined by over 35% in nearly two months, as the crypto market has shown an increased correlation to macroeconomics.
Additionally, US spot Ethereum exchange-traded funds (ETFs) marked a record 13 consecutive days of net outflows last week, shedding nearly $390 million during the period, per Farside data.
The weakness in prices and ETH ETF flows has also trickled into on-chain activity, with Ethereum's average transaction count dropping to levels last seen before Donald Trump’s presidential election victory.
-638784435975551329.png)
Ethereum average transaction count. Source: CryptoQuant
Ethereum's average transaction fees also plummeted to an all-time low over the past week following the declining on-chain activity and weak prices.
Transaction fees play a critical role in the valuation of smart contract blockchain tokens, especially in Ethereum's case, where portions of fees go to validators and a burner address.
 (1)-638784436361961478.png)
Ethereum average transaction fees. Source: CryptoQuant
With transaction fees declining, the amount of ETH burnt daily plunged to all-time lows, sparking an inflationary trend in ETH. According to data from Ultrasound.money, the projected ETH burn rate has declined to 25K ETH/year, and its supply growth has risen to an annual 0.76%.
Additionally, lower fees also slightly affect staking rewards. If fees and prices continue to plummet, stakers may be incentivized to unstake their tokens, further expanding ETH's circulating supply.
In a recent research report, Grayscale noted that ETH's weak price performance in the current market cycle stems from market participants valuing it based on fees captured on the Ethereum blockchain.
“Grayscale Research sees Ether’s underperformance as a healthy sign that crypto markets are focused on fundamentals,” the report states.
“Since the end of 2023, Solana has gained fee revenue and market share in the Smart Contract Platforms Crypto Sector, while Ethereum has lost fee revenue and market cap. In other words, markets have appropriately repriced the relative value of Ethereum and Solana due to changes in fundamentals," the Grayscale Research team added.
Ethereum Price Forecast: ETH attempts to clear $2,069 key resistance
Ethereum saw $42.43 million in futures liquidations in the past 24 hours, per Coinglass data. The total amount of long and short liquidations is $10.60 million and $31.83 million, respectively.
Ethereum moved above the $2,069 resistance of a rectangular channel for the first time in two weeks. The move comes after ETH bounced off a descending channel's support last Friday.
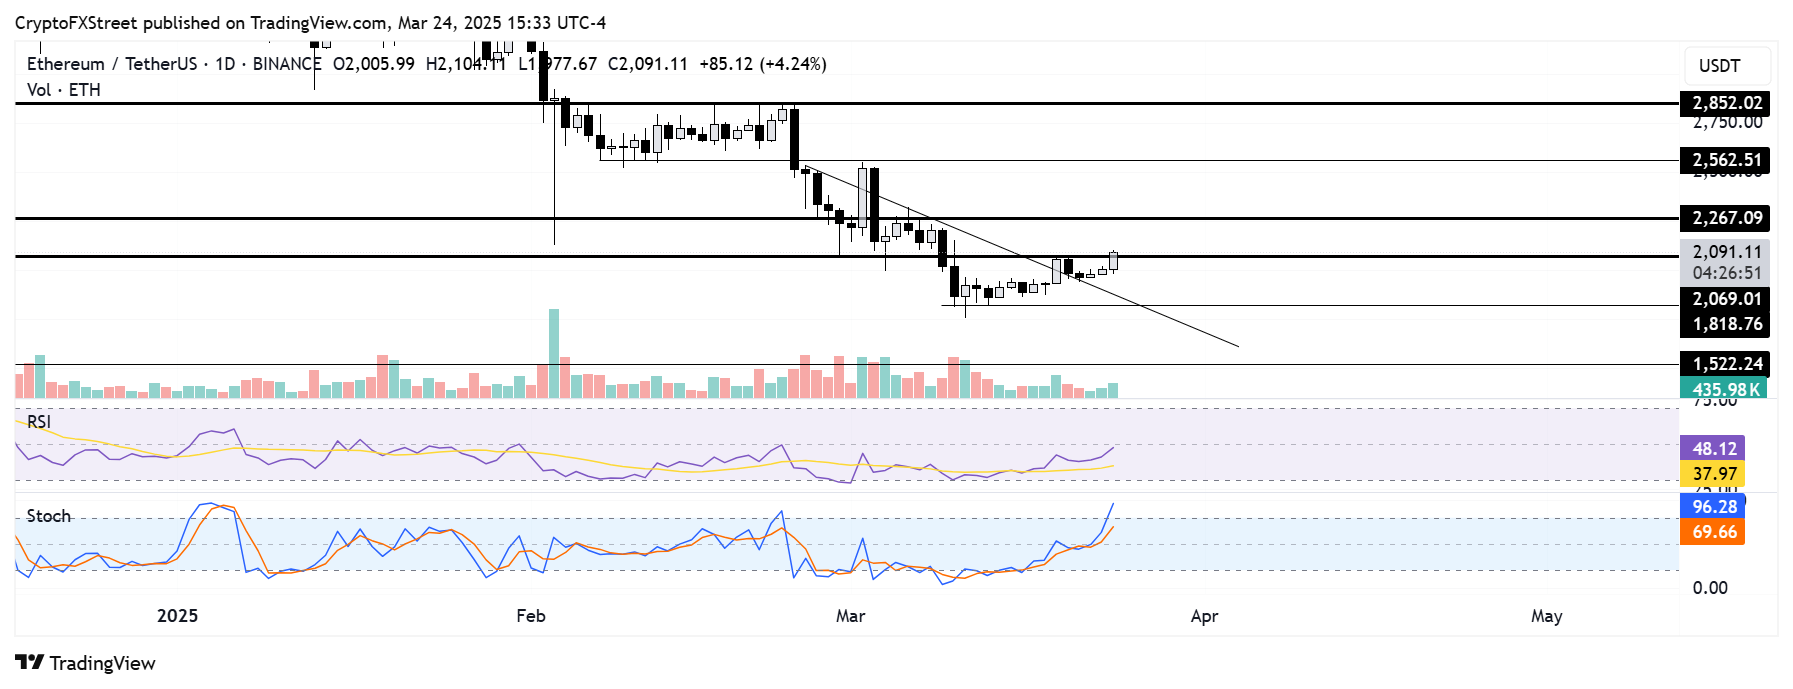
ETH/USDT daily chart
A rejection at $2,069 could send the top altcoin toward the $1,818 support level. However, a firm move above $2,069 could send ETH to test the $2,267 level.
The Relative Strength Index (RSI) is below its neutral level but trending upward, indicating a weakening bearish momentum. Meanwhile, the Stochastic Oscillator (Stoch) crossed to the overbought region, signaling a potential correction.
A daily candlestick below $1,800 will invalidate the thesis and potentially send ETH to $1,500.
Ethereum FAQs
Ethereum is a decentralized open-source blockchain with smart contracts functionality. Its native currency Ether (ETH), is the second-largest cryptocurrency and number one altcoin by market capitalization. The Ethereum network is tailored for building crypto solutions like decentralized finance (DeFi), GameFi, non-fungible tokens (NFTs), decentralized autonomous organizations (DAOs), etc.
Ethereum is a public decentralized blockchain technology, where developers can build and deploy applications that function without the need for a central authority. To make this easier, the network leverages the Solidity programming language and Ethereum virtual machine which helps developers create and launch applications with smart contract functionality.
Smart contracts are publicly verifiable codes that automates agreements between two or more parties. Basically, these codes self-execute encoded actions when predetermined conditions are met.
Staking is a process of earning yield on your idle crypto assets by locking them in a crypto protocol for a specified duration as a means of contributing to its security. Ethereum transitioned from a Proof-of-Work (PoW) to a Proof-of-Stake (PoS) consensus mechanism on September 15, 2022, in an event christened “The Merge.” The Merge was a key part of Ethereum's roadmap to achieve high-level scalability, decentralization and security while remaining sustainable. Unlike PoW, which requires the use of expensive hardware, PoS reduces the barrier of entry for validators by leveraging the use of crypto tokens as the core foundation of its consensus process.
Gas is the unit for measuring transaction fees that users pay for conducting transactions on Ethereum. During periods of network congestion, gas can be extremely high, causing validators to prioritize transactions based on their fees.
Recommended Articles


