Bitcoin Market May ‘Cool Off’ In 4 To 6 Weeks — But Here’s What Needs To Happen

Source Newsbtc

Over the years, investor sentiment has been one reliable way to analyze the Bitcoin and cryptocurrency market. Based on recent on-chain data, an analyst has pointed out how the changing investor sentiment could affect the world’s largest cryptocurrency over the next few weeks.

Can BTC Price Charge To New All-Time High?

In a recent post on X, crypto analyst Axel Adler Jr explained how the Bitcoin market dynamics could significantly shift in the coming weeks. This projection is based on recent changes in the “Bitcoin Fear and Greed Index.

The Bitcoin Fear and Greed Index refers to a metric that aggregates the average sentiment of investors in the BTC market. The indicator is divided into five zones, including extreme fear, fear, neutral, greed, and extreme greed.

Extreme fear signals that traders and investors are moving with high caution, while extreme greed suggests an overheating market condition with traders flooding in with new positions. Historically, periods of extreme fear have been correlated with market bottoms while price corrections usually occur during extreme greed.

According to Adler Jr., the 90-day simple moving average (SMA) of the Bitcoin Fear and Greed Index has fallen by approximately 22 percentage points over the past two months. This decline has seen the BTC metric shift from extreme greed to a more moderate level of greed.

Bitcoin

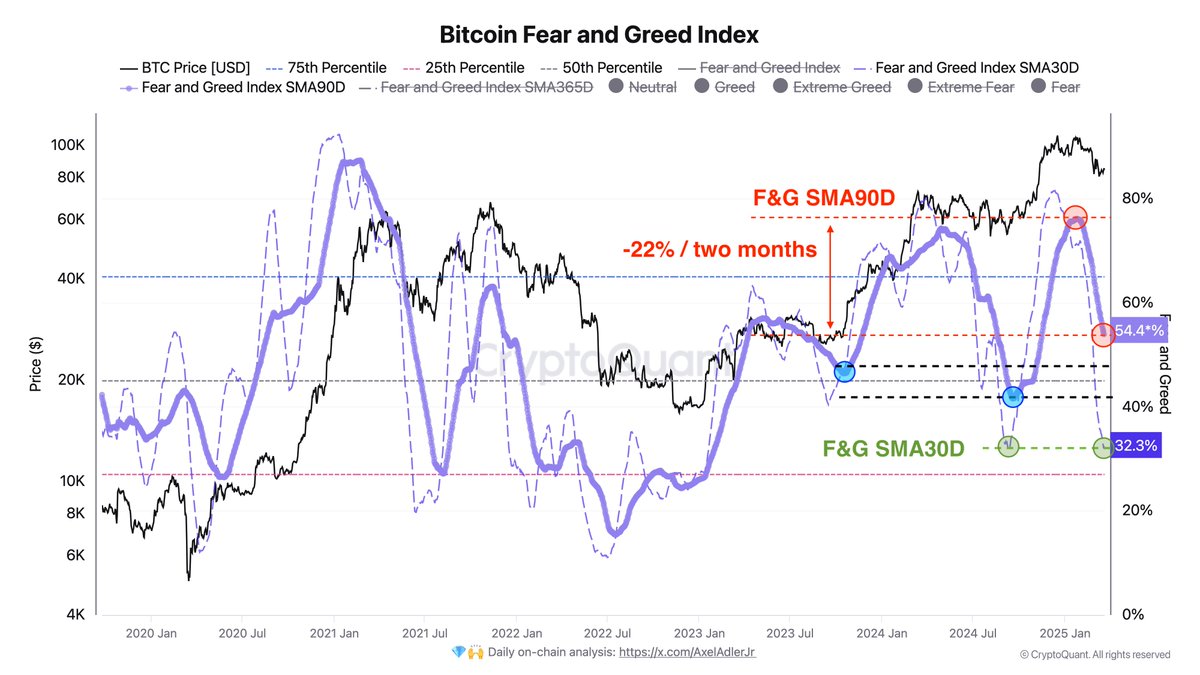
Going further, the on-chain analyst mentioned that if the Bitcoin Fear and Greed Index drops by another 10 to 15 points in the near future, the market may experience a cooling-off period where participants could have become accustomed to negative factors and emotional price movements may even subside.

Adler Jr added in his post:

At the current pace, it may take approximately 4 to 6 weeks for the index to drop by an additional 10–15 points.

The analyst also highlighted that the 30-day (monthly) moving average appears to be reaching a local bottom, one seen at the end of the Bitcoin price correction to $54,000. The last time the Fear and Greed Index monthly SMA reached this level, the premier cryptocurrency climbed to a new all-time high price. If this historical pattern holds, investors could see the BTC price break out of its consolidation range.

Bitcoin Price At A Glance

As of this writing, the price of BTC is just beneath the $84,000 level, reflecting a 0.5% decline in the past 24 hours. 

Bitcoin
Disclaimer: For information purposes only. Past performance is not indicative of future results.
placeholder
Gold price declines amid risk-on sentiment despite Fed rate cut expectationsGold price (XAU/USD) continues with its struggle to find acceptance above the $3,400 mark and attracts heavy selling during the Asian session on Monday.
Author  FXStreet
Aug 11, 2025
Gold price (XAU/USD) continues with its struggle to find acceptance above the $3,400 mark and attracts heavy selling during the Asian session on Monday.
placeholder
EUR/USD Price Forecast: Keeps bullish vibe above 1.1600 despite France’s deepening political crisisThe EUR/USD pair loses ground to near 1.1620 during the early European session on Monday.
Author  FXStreet
Oct 27, 2025
The EUR/USD pair loses ground to near 1.1620 during the early European session on Monday.
placeholder
ECB Policy Outlook for 2026: What It Could Mean for the Euro’s Next MoveWith the ECB likely holding rates steady at 2.15% and the Fed potentially extending cuts into 2026, EUR/USD may test 1.20 if Eurozone growth proves resilient, but weaker growth and an ECB pivot could pull the pair back toward 1.13 and potentially 1.10.
Author  Mitrade
Dec 26, 2025
With the ECB likely holding rates steady at 2.15% and the Fed potentially extending cuts into 2026, EUR/USD may test 1.20 if Eurozone growth proves resilient, but weaker growth and an ECB pivot could pull the pair back toward 1.13 and potentially 1.10.
placeholder
Gold plummets below $4,200 as US‑Iran tensions spur hawkish rate bets ahead of US CPIGold (XAU/USD) extends the recent breakdown momentum below a technically significant 200-day Simple Moving Average (SMA) and drops to a fresh low since March 23, further below the $4,200 mark during the Asian session on Wednesday.
Author  FXStreet
Yesterday 08: 26
Gold (XAU/USD) extends the recent breakdown momentum below a technically significant 200-day Simple Moving Average (SMA) and drops to a fresh low since March 23, further below the $4,200 mark during the Asian session on Wednesday.
placeholder
BTC Hovers Near 60,000 Mark After Plunge. US May CPI Set to Be Revealed, How Is Wall Street Betting?Bitcoin's rebound falters as the U.S.-Iran conflict and CPI data likely sustain downward pressure.On June 10, escalating U.S.-Iran tensions put the already fragile crypto market to the te
Author  TradingKey
Yesterday 09: 57
Bitcoin's rebound falters as the U.S.-Iran conflict and CPI data likely sustain downward pressure.On June 10, escalating U.S.-Iran tensions put the already fragile crypto market to the te
goTop
quote